
UNITED STATES
SECURITIES AND EXCHANGE COMMISSION
Washington, D.C. 20549
Form 10-K
FOR ANNUAL AND TRANSITION REPORTS
PURSUANT TO SECTIONS 13 OR 15(d) OF THE
SECURITIES EXCHANGE ACT OF 1934
(Mark One)
| þ | ANNUAL REPORT PURSUANT TO SECTION 13 OR 15(d) OF THE SECURITIES EXCHANGE ACT OF 1934 |
For the fiscal year ended December 31, 2010
or
| ¨ | TRANSITION REPORT PURSUANT TO SECTION 13 OR 15(d) OF THE SECURITIES EXCHANGE ACT OF 1934 |
For the transition period from to
Commission file number 001-15451
United Parcel Service, Inc.
(Exact Name of Registrant as Specified in Its Charter)
| Delaware | 58-2480149 | |
| (State or Other Jurisdiction of Incorporation or Organization) |
(I.R.S. Employer Identification No.) | |
| 55 Glenlake Parkway, N.E. Atlanta, Georgia | 30328 | |
| (Address of Principal Executive Offices) | (Zip Code) |
(404) 828-6000
(Registrant’s telephone number, including area code)
Securities registered pursuant to Section 12(b) of the Act:
| Title of Each Class |
Name of Each Exchange on Which Registered | |
| Class B common stock, par value $.01 per share | New York Stock Exchange |
Securities registered pursuant to Section 12(g) of the Act:
Class A common stock, par value $.01 per share
(Title of Class)
Indicate by check mark if the registrant is a well-known seasoned issuer, as defined in Rule 405 of the Securities Act. Yes þ No ¨
Indicate by check mark if the registrant is not required to file reports pursuant to Section 13 or Section 15(d) of the Exchange Act. Yes ¨ No þ
Indicate by check mark whether the registrant: (1) has filed all reports required to be filed by Section 13 or 15(d) of the Securities Exchange Act of 1934 during the preceding 12 months (or for such shorter period that the registrant was required to file such reports), and (2) has been subject to such filing requirements for the past 90 days. Yes þ No ¨
Indicate by check mark whether the registrant has submitted electronically and posted on its corporate Web site, if any, every Interactive Data File required to be submitted and posted pursuant to Rule 405 of Regulation S-T during the preceding 12 months (or for such shorter period that the registrant was required to submit and post such files). Yes þ No ¨
Indicate by check mark if disclosure of delinquent filers pursuant to Item 405 of Regulation S-K is not contained herein, and will not be contained, to the best of registrant’s knowledge, in definitive proxy or information statements incorporated by reference in Part III of this Form 10-K or any amendment to this Form 10-K. þ
Indicate by check mark whether the registrant is a large accelerated filer, an accelerated filer, a non-accelerated filer or a smaller reporting company. See definition of “accelerated filer”, “large accelerated filer” and “smaller reporting company” in Rule 12b-2 of the Exchange Act. Check one:
| Large accelerated filer þ |
Accelerated filer ¨ | Non-accelerated filer ¨ | Smaller reporting company ¨ |
Indicate by check mark whether the registrant is a shell company (as defined in Rule 12b-2 of the Exchange Act). Yes ¨ No þ
The aggregate market value of the class B common stock held by non-affiliates of the registrant was $41,146,287,739 as of June 30, 2010. The registrant’s class A common stock is not listed on a national securities exchange or traded in an organized over-the-counter market, but each share of the registrant’s class A common stock is convertible into one share of the registrant’s class B common stock.
As of February 15, 2011, there were 252,287,206 outstanding shares of class A common stock and 734,831,168 outstanding shares of class B common stock.
DOCUMENTS INCORPORATED BY REFERENCE
Portions of the registrant’s definitive proxy statement for its annual meeting of shareowners scheduled for May 5, 2011 are incorporated by reference into Part III of this report.
ANNUAL REPORT ON FORM 10-K FOR THE YEAR ENDED DECEMBER 31, 2010
TABLE OF CONTENTS
| PART I | ||||||
| Item 1. |
1 | |||||
| 1 | ||||||
| 2 | ||||||
| 4 | ||||||
| 5 | ||||||
| 6 | ||||||
| 7 | ||||||
| 7 | ||||||
| 8 | ||||||
| 8 | ||||||
| 9 | ||||||
| Item 1A. |
11 | |||||
| Item 1B. |
16 | |||||
| Item 2. |
16 | |||||
| 16 | ||||||
| 18 | ||||||
| 18 | ||||||
| Item 3. |
19 | |||||
| Item 4. |
19 | |||||
| PART II | ||||||
| Item 5. |
20 | |||||
| 21 | ||||||
| Item 6. |
22 | |||||
| Item 7. |
Management’s Discussion and Analysis of Financial Condition and Results of Operations |
23 | ||||
| 36 | ||||||
| 45 | ||||||
| Item 7A. |
50 | |||||
| Item 8. |
53 | |||||
| Report of Independent Registered Public Accounting Firm on Internal Control over Financial Reporting |
53 | |||||
| 54 | ||||||
| 55 | ||||||
| 56 | ||||||
| 56 | ||||||
| 57 | ||||||
| 58 | ||||||
| Item 9. |
Changes in and Disagreements with Accountants on Accounting and Financial Disclosure |
112 | ||||
| Item 9A. |
113 | |||||
| Item 9B. |
113 | |||||
| PART III | ||||||
| Item 10. |
114 | |||||
| Item 11. |
115 | |||||
| Item 12. |
Security Ownership of Certain Beneficial Owners and Management and Related Stockholder Matters |
115 | ||||
| Item 13. |
Certain Relationships and Related Transactions, and Director Independence |
115 | ||||
| Item 14. |
116 | |||||
| PART IV | ||||||
| Item 15. |
117 | |||||
PART I
| Item 1. | Business |
United Parcel Service, Inc. (“UPS”) is the world’s largest package delivery company, a leader in the U.S. less-than-truckload industry, and a global leader in supply chain management. We were founded in 1907 as a private messenger and delivery service in Seattle, Washington. Today, we deliver packages each business day for 1.1 million shipping customers to 7.4 million consignees in over 220 countries and territories. In 2010, we delivered an average of 15.6 million pieces per day worldwide, or a total of 3.94 billion packages. Total revenue in 2010 was $49.5 billion.
Our primary business is the time-definite delivery of packages and documents worldwide. The UPS service portfolio also includes global supply chain services and less-than-truckload transportation, primarily in the United States. We report our operations in three segments: U.S. Domestic Package operations, International Package operations, and Supply Chain & Freight operations.
| • | U.S. Domestic Package operations include the time-definite delivery of letters, documents, and packages throughout the United States. |
| • | International Package operations encompass delivery of letters, documents and packages to more than 220 countries and territories worldwide, including shipments wholly outside the United States, as well as shipments from or to the United States with another country as the destination or origin point. |
| • | Supply Chain & Freight is comprised of our forwarding and logistics operations, UPS Freight, and other related businesses. Our forwarding and logistics business provides services in more than 195 countries and territories worldwide, and includes supply chain design and management, freight distribution, customs brokerage, mail and consulting services. UPS Freight offers a variety of less-than-truckload (“LTL”) and truckload (“TL”) services to customers in North America. Other business units within this segment include Mail Boxes Etc.® (the franchisor of Mail Boxes Etc.® and The UPS Store®) and UPS Capital®. |
Transportation and Infrastructure. We operate a ground fleet of approximately 99,800 vehicles, which reaches all business and residential zip codes in the contiguous U.S. We also operate an air fleet of 527 aircraft, and we are one of the largest airlines in the world. Our primary air hub is in Louisville, Kentucky. Regional air hubs are located in Hartford, Connecticut; Ontario, California; Philadelphia, Pennsylvania; and Rockford, Illinois. Our largest international air hub is in Cologne, Germany, with other regional international hubs in Miami, Florida; Canada; Hong Kong; Singapore; Taiwan; and China.
We operate a global transportation infrastructure and offer a comprehensive portfolio of services. We support these services with advanced operational and customer-facing technology. Our supply chain solutions enable customers’ inventory to move more effectively. As a consequence, they can concentrate on their own core competencies.
Outlook. Mixed economic results in 2010, combined with improving economic forecasts as the year ended, lead us to believe that the following trends will allow us to continue to grow our business over the long-term:
| • | We expect the economic recovery to continue at a modest pace in 2011. Global economies continue to expand at less than historical trends. The sovereign debt crisis that plagued Europe in 2010 will continue to be an area of concern in 2011. |
| • | Just-in-time inventory management, increased use of the Internet for ordering goods, and direct-to-consumer business models require transportation services to be effective. |
| • | Outsourcing supply chain management is becoming more prevalent, as customers increasingly view effective management of their supply chains as a strategic advantage. |
1
Our vision for the future is to synchronize the world of commerce, addressing the complexities of our customers’ supply chain needs. Our goal is to develop business solutions that create value and competitive advantages for our customers, enabling them to achieve supply chain efficiencies, better customer service for their customers and improved cash flows.
We believe that our integrated global network is the most extensive in the industry. It is the only network that handles all levels of service (air, ground, domestic, international, commercial, residential) through one integrated pickup and delivery service system. All packages are commingled throughout their journey through our network, except when necessary to meet their specific service commitments.
U.S. Domestic Package
The U.S. business consists of air and ground delivery of small packages—up to 150 pounds in weight—and letters to and from all 50 states. It also provides guaranteed, time-definite delivery of certain heavyweight packages. Substantially all of our U.S. small package delivery services are guaranteed.
The integrated air and ground pick-up and delivery network on which this business is built improves productivity and asset utilization, and provides the flexibility to transport packages using the most reliable and cost-effective transportation mode or combination of modes.
In 2010, UPS completed the second phase of a multi-year expansion of the fully automated Worldport® air hub in Louisville, KY, our largest air hub. Worldport® sort capacity has been expanded to 416,000 packages per hour—a 37% increase. This expansion enables more cost-effective package processing and enables the use of larger, more fuel efficient aircraft.
During the first quarter of 2010, UPS completed a restructuring of its U.S. package operations. With this new structure, we now have the opportunity to better deliver the value our solutions bring to small and medium-sized customers.
In 2009, we expanded our early morning delivery service. UPS now delivers earlier to more businesses and zip codes in the United States, and earlier to more countries from the United States, than our competitors.
We believe that our broad product portfolio, reliable package delivery service, experienced and dedicated employees and unmatched, integrated air and ground network provide us with the advantages of reputation, service quality and economies of scale that differentiate us from our competitors. Our strategy is to increase domestic revenue through cross-selling services to our large and diverse customer base, to control costs through effective network modification and limited expense growth, and to employ technology-driven efficiencies to increase operating profit.
International Package
The International Package segment provides air and ground delivery of small packages and letters to more than 220 countries and territories around the world. Export services cross country boundaries; domestic services move shipments within a country’s borders. UPS’s global presence grew out of its highly refined U.S. domestic business.
| • | Europe is our largest region outside the United States—accounting for approximately half of our international revenue. In Europe we provide both express and domestic service, much like the service portfolio we offer in the U.S., and based on the same integrated network model. |
2
| • | Through more than two dozen alliances with Asian delivery companies that supplement company-owned operations, we serve more than 40 Asia-Pacific countries and territories. One of the fastest growing economies in the world, China, is among our most promising opportunities. |
| • | Our Canadian operations include both domestic and import/export capabilities. We deliver to all addresses throughout Canada. |
| • | We are also the largest air cargo carrier in Latin America and the Caribbean. |
We have built a strong international presence through significant investments over several decades. Some of our recent acquisitions and investments include the following:
| • | In 2008, we completed construction of a new hub in Tamworth, England, UPS’s largest ground hub outside the U.S. It replaced three smaller facilities, and added more capacity and better efficiencies than existed with the three separate facilities. |
| • | Also in 2008, we acquired our partner’s interest in the small package joint venture operation in Romania. |
| • | In 2009, we expanded our presence in Eastern Europe and in Central Asia with the acquisition of our service agents in Slovenia and Turkey, respectively. |
| • | Also in 2009, we set up a joint venture in Dubai to coordinate management and growth of UPS express package, freight forwarding and contract logistics services across the Middle East, Turkey and portions of Central Asia. |
| • | In 2010, we established or expanded relationships with alliance partners in Vietnam, Malaysia and Indonesia. |
| • | Also in 2010, we submitted an application for a domestic service license in China. We believe that we will receive approval in 2011. |
Growth in Asia is being driven by global demand, which is stimulating improved demographic and economic trends throughout the region, particularly in China. Over the last few years, UPS has steadily increased air service between the U.S. and Asia.
| • | In 2008, we opened a new air hub in Shanghai, the first constructed in China by a U.S. carrier. It links all of China via Shanghai to UPS’s international network with direct service to the Americas, Europe and Asia. It also connects points served in China by UPS. |
| • | Also in 2008, we acquired our partner’s interest in a small package shipping joint venture in Korea. |
| • | In 2010, we opened a new Intra-Asia air hub. The Shenzhen Asia-Pacific Hub, located at Shenzhen Baoan International Airport in China’s thriving Pearl River Delta, replaced a UPS hub in the Philippines. The hub represents an investment of $180 million and has reduced shipment time-in-transit by at least a day for customers in the region. |
The international package delivery market has been growing at a faster rate than that of the U.S., and our international package operations have historically been growing faster than the market. We plan to use our worldwide infrastructure and broad product portfolio to grow high-margin premium services. Additionally, we plan to expand our non-U.S. domestic package operations by continuing to build our package delivery infrastructure and through acquisitions in certain countries. We have been and will continue to implement cost, process and technology improvements in our international operations. We believe that both Europe and Asia offer significant opportunities for long-term growth.
Supply Chain & Freight
The Supply Chain & Freight segment consists of our forwarding and logistics capabilities as well as our UPS Freight business unit.
3
Supply chains are becoming increasingly complex. Many of our customers, large and small, have outsourced all or part of their supply chains to streamline and gain efficiencies, to improve service, to support new business models and to strengthen their balance sheets.
This increasing complexity creates demand for a global service offering that incorporates transportation, distribution and international trade and brokerage services with financial and information services. We can meet that demand because:
| • | We manage supply chains in over 195 countries and territories, with approximately 31 million square feet of distribution space worldwide. |
| • | We focus on supply chain optimization, freight forwarding, international trade and brokerage services for our customers worldwide, which include a broad range of transportation solutions including air, ocean and ground freight. |
| • | We provide information technology systems and distribution facilities adapted to the unique supply chains of specific industries such as healthcare, technology and consumer/retail. We call these “configurable solutions.” In a configurable solution, multiple customers share standardized information technology systems and processes as well as a common network of assets. A configurable solution is repeatable for multiple customers and has a package transportation component. For example, we have a well developed supply chain management capability for the healthcare sector that meets all regulatory and compliance requirements. |
| • | We offer a portfolio of financial services that provides customers with short-term working capital, government guaranteed lending, global trade financing, credit cards and export financing. |
UPS Freight is an LTL service, which offers a full range of regional, inter-regional and long-haul LTL capabilities in all 50 states, Canada, Puerto Rico, Guam, the Virgin Islands and Mexico. This business also offers a TL service. UPS Freight provides services through a network of owned and leased service centers and carrier partnerships.
Our growth strategy is to increase the number of customers benefiting from configurable supply chain solutions, particularly in the healthcare, technology, and retail sectors, and to increase the amount of small package transportation from these customers. We intend to leverage our small package and freight customers through cross-selling the full complement of UPS services.
Our goal is to provide our customers with easy-to-use products and services. We seek to streamline their shipment processing and integrate critical transportation information into their own business processes, helping them create supply chain efficiencies, better serve their customers and improve their cash flows. These products and services support LTL and air freight shipments, as well as small package transportation. UPS offers a variety of technology solutions for automated shipping, visibility and billing. We believe we have the most comprehensive suite of such services in the industry.
Global Small Package. Our global small package portfolio consists of a spectrum of export and domestic services. Export services are those provided for packages crossing a country’s borders, while domestic services are for packages that stay within the borders of a single country. We provide domestic express services in 55 countries outside the United States. This portfolio includes guaranteed delivery options to major cities around the world. We handle packages that weigh up to 150 pounds and are up to 165 inches in combined length and girth. We offer same-day pickup of air and ground packages. We also offer worldwide customs clearance service for any mode of transportation.
Additional products that provide enhanced shipping, visibility, billing and return services are available to customers who require customized package solutions.
4
Our enhanced, data-driven package pick-up and delivery technology is the basis for new services introduced in recent years. For example, UPS introduced a unique paperless invoice service for international small package shippers that integrates order processing, shipment preparation and commercial invoice data and then transmits that data to customs offices across the globe, eliminating the need for paper commercial invoices. Another offering, UPS Returns®, is the first industry offering that facilitates international commerce for any size customer by simplifying package returns to 98 countries or territories. Package recipients can obtain international return labels and commercial invoices via e-mail, local post or from a UPS driver picking up the return package.
In 2010, UPS introduced UPS Smart Pickup® a new option for shippers who want the convenience of a scheduled pickup but may not ship a package everyday. This is the latest in a series of UPS Decision GreenSM offerings, this high-tech service alerts UPS drivers when a pickup needs to be made.
We provide our customers with easy access to UPS, with over 150,000 domestic and international access points including: 40,000 branded drop-boxes, 1,000 UPS customer centers, 4,700 independently owned and operated The UPS Store® and Mail Boxes Etc.® locations worldwide, 16,000 authorized shipping outlets and commercial counters, and 88,400 UPS drivers who can accept packages given to them.
Supply Chain Services. Our freight forwarding and logistics businesses meet customers’ supply chain needs through a comprehensive portfolio of services, including:
| • | Freight Forwarding: international air, full container load and less than container load ocean, rail and ground freight for all size shipments utilizing UPS and other carriers, and multimodal transportation network management. |
| • | Logistics and Distribution: supply chain management, distribution center design, planning and management, order fulfillment, inventory management, receiving and shipping, critical parts logistics, returns management, reverse logistics and cross docking. |
| • | Customs Brokerage: customs clearance, trade management and international trade consulting. |
| • | Industry-specific Solutions: healthcare, retail, technology, automotive, industrial manufacturing and government customers. |
| • | UPS Capital®: short-term working capital, government guaranteed lending, global trade financing, credit cards and export financing. |
In 2008, UPS launched a new, simplified global portfolio for shipping air freight, with guaranteed day-specific, door-to-door service as well as non-guaranteed service options.
Freight Services. UPS Freight provides LTL services through a network of owned and leased service centers and carrier partnerships. UPS Freight also provides our customers with truckload and dedicated truckload transportation solutions. Since expanding into the freight transport market, we have enhanced our value proposition through improvements in technology, operations and the customer experience. Significant service and reliability improvements for freight transportation enabled us to implement a no-fee, guaranteed delivery service in early 2008 and we expanded it to Canadian deliveries later in the year. In 2009, UPS Freight began offering door-to-door service to and from Mexico, complete with UPS customs brokerage capabilities and single invoicing for all services between the United States, Canada, and Mexico. In 2010, UPS Freight continued the acceleration of transit times when 150 U.S. and Canada lanes were improved. Over the last two years, we have made a total of 1,100 lane improvements.
Technology is the backbone of everything we do at UPS. It is at the heart of customer access to our company.
| • | UPS.com processes over 26 million package tracking transactions daily. A growing number of those tracking requests come from customers in countries that have wireless access to UPS tracking information. |
5
| • | Package tracking, pickup requests, rate quotes, account opening, wireless registration, drop-off locator, transit times and supply ordering services are all available at customers’ desktops or laptops. The site also displays full domestic and international service information and allows customers to process outbound shipments as well as return labels for their customers. |
| • | Businesses in a number of countries also can download UPS Developer Kit™ to their own websites for direct use by their customers. This allows users to access the information they need without leaving our customers’ websites. |
Technology is also the foundation for process improvements within UPS that enhance productivity, improve efficiency and reduce costs. In recent years, we completed the most comprehensive improvement to our U.S. small package handling facilities. This multi-year effort re-engineered our domestic business, based on a data-driven platform, and included software, hardware and process changes. It enables a package center to produce an optimized dispatch plan for every driver and detailed loading instructions for every vehicle before center employees handle any packages. This plan reduces mileage driven, resulting in substantial fuel savings. The re-engineered system provides the basis for unique customer-focused services based on the customer-specific data which powers the system.
A new technology we began deploying in 2008 is telematics, which combines information from our drivers’ hand-held computers with GPS and automotive sensors to help us better manage our ground fleet operations. It helps us improve vehicle maintenance, enhance safety and fine-tune delivery and pick-up service. This technology also improves on-road performance by reducing vehicle expense, fuel consumption, and carbon emissions. Since 2008, we have equipped approximately 24,000 of our U.S. vehicles with the sensors needed to achieve the benefits from this technology.
Our business strategy and corporate responsibility strategy are substantially the same: to increase the economic vitality and environmental sustainability of the global economy by aggregating the shipping activity of millions of businesses and individuals worldwide into a single highly efficient logistics network. The website www.sustainability.ups.com provides complete information on this strategy. This approach:
| • | Benefits UPS by ensuring strong demand for our products and services; |
| • | Benefits the economy by making global supply chains more efficient and less expensive by enabling businesses the ability to focus more tightly on their core competencies and reduce the additional operating costs associated with moving their goods; and |
| • | Benefits the environment by reducing the carbon intensity of global shipping activities and enabling UPS to leverage its own carbon efficiency improvements into the supply chains of all its customers. |
We continually strive to improve our efficiencies and reduce the overall energy and emissions intensity of our global distribution network.
At UPS, we recognize our management approach for avoiding energy use and emissions as “decarbonization synergy”. This means we simultaneously pursue multiple strategies for carbon avoidance, in a way that makes each one stronger and more effective than it would be on its own. A simple, yet powerful, example of decarbonization synergy at UPS is our ability to handle all categories of service (express, ground, domestic, international, commercial, residential) through one integrated pickup and delivery service system. We believe our integrated network is a competitive advantage, therefore, we are able to use all assets more efficiently and achieve far greater carbon avoidance.
6
The UPS worldwide sales organization is responsible for the complete spectrum of UPS products and services. Our sales force includes specialized groups that work with our general sales organization to support UPS subsidiaries and specialized products.
In early 2010, we completed a streamlining of the U.S. Domestic Package operations, and as part of the restructuring, we expanded our outreach to customers by strengthening local sales and marketing efforts.
Our worldwide marketing organization, which was also reorganized in 2010, supports our global small package, supply chain and freight businesses. Our corporate marketing function is engaged in market and customer research, brand management, segment management, rate-making and revenue management policy, pricing, new product development, product portfolio management, marketing alliances, and technology marketing, including the non-technical aspect of our web presence. Advertising, public relations, brand management, and most formal marketing communications are generally centrally developed and controlled.
In addition to our corporate marketing group, field-based marketing personnel are assigned to our individual operating units and are primarily engaged in business planning, market analysis and opportunity identification, segment management, and customer profitability management.
In 2011, we are implementing a major sales force reorganization to better align our sales resources with customer business processes along industry verticals. Our goal is to enhance the customer experience when dealing with the extensive scope of UPS capabilities at any point in the shipping or supply chain management process.
We had approximately 400,600 employees as of December 31, 2010, of which 330,600 are in the U.S. and 70,000 are located internationally.
As of December 31, 2010, we had approximately 250,000 employees employed under a national master agreement and various supplemental agreements with local unions affiliated with the International Brotherhood of Teamsters (“Teamsters”). These agreements run through July 31, 2013.
We have approximately 2,800 pilots who are employed under a collective bargaining agreement with the Independent Pilots Association, which becomes amendable at the end of 2011. Our airline mechanics are covered by a collective bargaining agreement with Teamsters Local 2727, which became amendable in November 2006. We began formal negotiations with Teamsters Local 2727 in October 2006, and have been under the guidance of the National Mediation Board since January 2008. In January 2011, we reached a tentative agreement with Teamsters Local 2727 which will run through November 1, 2013 when ratified. In addition, the majority (approximately 3,300) of our ground mechanics who are not employed under agreements with the Teamsters are employed under collective bargaining agreements with the International Association of Machinists and Aerospace Workers (“IAM”). Our agreement with the IAM runs through July 31, 2014.
We believe that our relations with our employees are good. We periodically survey all our employees to determine their level of job satisfaction. Areas of concern receive management attention as we strive to keep UPS the employer of choice among our employees.
We consistently receive numerous awards and wide recognition as an employer-of-choice, resulting in part from our emphasis on diversity and corporate citizenship.
7
We are the largest package delivery company in the world, in terms of both revenue and volume. We offer a broad array of services in the package and freight delivery industry and, therefore, compete with many different local, regional, national and international companies. Our competitors include worldwide postal services, various motor carriers, express companies, freight forwarders, air couriers and others. Through our supply chain service offerings, we compete with a number of participants in the supply chain, financial services and information technology industries.
Our competitive strengths include:
Integrated Global Network. We believe that our integrated global ground and air network is the most extensive in the industry. It is the only network that handles all levels of service (air, ground, domestic, international, commercial, residential) through a single pickup and delivery service system.
Our sophisticated engineering systems allow us to optimize our network efficiency and asset utilization on a daily basis. This unique, integrated global business model creates consistent and superior returns.
We believe we have the most comprehensive integrated delivery and information services portfolio of any carrier in Europe. In other regions of the world, we rely on both our own and local service providers’ capabilities to meet our service commitments.
Global Presence. UPS serves more than 220 countries and territories around the world. We have a presence in all of the major economies and are among the leaders in most of them.
Leading-edge Technology. We are a global leader in developing technology that helps our customers optimize their shipping and logistics business processes to lower costs, improve service and increase efficiency.
Technology powers virtually every service we offer and every operation we perform. Our technology initiatives are driven by our customers’ needs. We offer a variety of on-line service options that enable our customers to integrate UPS functionality into their own businesses not only to conveniently send, manage and track their shipments, but also to provide their customers with better information services. We provide the infrastructure for an Internet presence that extends to tens of thousands of customers who have integrated UPS tools directly into their own web sites.
Broad Portfolio of Services. Our portfolio of services enables customers to choose the delivery option that is most appropriate for their requirements. Increasingly, our customers benefit from business solutions that integrate many UPS services in addition to package delivery. For example, our supply chain services—such as freight forwarding, customs brokerage, order fulfillment, and returns management—help improve the efficiency of the supply chain management process.
Customer Relationships. We focus on building and maintaining long-term customer relationships. We serve 1.1 million pick-up customers and 7.4 million delivery customers daily. Cross-selling small package, supply chain and freight services across our customer base is an important growth mechanism for UPS.
Brand Equity. We have built a leading and trusted brand that stands for quality service, reliability and product innovation. The distinctive appearance of our vehicles and the friendliness and helpfulness of our drivers are major contributors to our brand equity.
Distinctive Culture. We believe that the dedication of our employees results in large part from our distinctive “employee-owner” concept. Our employee stock ownership tradition dates from 1927, when our
8
founders, who believed that employee stock ownership was a vital foundation for successful business, first offered stock to employees. To facilitate employee stock ownership, we maintain several stock-based compensation programs.
Our long-standing policy of “promotion from within” complements our tradition of employee ownership, and this policy reduces the need for us to hire managers and executive officers from outside UPS. The majority of our management team began their careers as full-time or part-time hourly UPS employees, and have spent their entire careers with us. Many of our executive officers have more than 30 years of service with UPS and have accumulated a meaningful ownership stake in our company. Therefore, our executive officers have a strong incentive to effectively manage UPS, which benefits all our shareowners.
Financial Strength. Our balance sheet reflects financial strength that few companies can match. As of December 31, 2010, we had a balance of cash and marketable securities of approximately $4.081 billion and shareowners’ equity of $8.047 billion. Our Moody’s and Standard & Poor’s short-term credit ratings are P-1 and A-1+, respectively, and our Moody’s and Standard & Poor’s long-term credit ratings are Aa3 and AA-, respectively. We have a stable outlook from Moody’s and Standard & Poor’s. We have a strong capacity to service our obligations. Our financial strength gives us the resources to achieve global scale; to invest in employee development, technology, transportation equipment and buildings; to pursue strategic opportunities that facilitate our growth; and to return value to our shareowners in the form of dividends and share repurchases.
Air Operations
The U.S. Department of Transportation (“DOT”), the Federal Aviation Administration (“FAA”), and the U.S. Department of Homeland Security, through the Transportation Security Administration (“TSA”), have regulatory authority over United Parcel Service Co.’s (“UPS Airlines’”) air transportation services. The Federal Aviation Act of 1958, as amended, is the statutory basis for DOT and FAA authority and the Aviation and Transportation Security Act of 2001, as amended, is the basis for TSA aviation security authority.
The DOT’s authority primarily relates to economic aspects of air transportation, such as discriminatory pricing, non-competitive practices, interlocking relations and cooperative agreements. The DOT also regulates, subject to the authority of the President of the United States, international routes, fares, rates and practices, and is authorized to investigate and take action against discriminatory treatment of U.S. air carriers abroad. International operating rights for U.S. airlines are usually subject to bilateral agreement between the U.S. and foreign governments. UPS Airlines has international route operating rights granted by the DOT and we may apply for additional authorities when those operating rights are available and are required for the efficient operation of our international network. The efficiency and flexibility of our international air transportation network is dependent on DOT and foreign government regulations and operating restrictions.
The FAA’s authority primarily relates to safety aspects of air transportation, including aircraft operating procedures, transportation of hazardous materials, record keeping standards and maintenance activities, personnel and ground facilities. In 1988, the FAA granted us an operating certificate, which remains in effect so long as we meet the safety and operational requirements of the applicable FAA regulations. In addition, we are subject to non-U.S. government regulation of aviation rights involving non-U.S. jurisdictions, and non-U.S. customs regulation.
FAA regulations mandate an aircraft corrosion control program, along with aircraft inspection and repair at periodic intervals specified by approved programs and procedures, for all aircraft. Our total expenditures under these programs for 2010 were $13 million. The future cost of repairs pursuant to these programs may fluctuate according to aircraft condition, age and the enactment of additional FAA regulatory requirements.
9
The TSA regulates various security aspects of air cargo transportation in a manner consistent with the TSA mission statement to “protect the Nation’s transportation systems to ensure freedom of movement for people and commerce.” UPS Airlines, and specified airport and off airport locations, are regulated under TSA regulations applicable to the transportation of cargo in an air network. In addition, personnel, facilities and procedures involved in air cargo transportation must comply with TSA regulations.
UPS Airlines, along with a number of other domestic airlines, participates in the Civil Reserve Air Fleet (“CRAF”) program. Our participation in the CRAF program allows the U.S. Department of Defense (“DOD”) to requisition specified UPS Airlines wide-body aircraft for military use during a national defense emergency. The DOD compensates us for the use of aircraft under the CRAF program. In addition, participation in CRAF entitles UPS Airlines to bid for military cargo charter operations.
Ground Operations
Our ground transportation of packages in the U.S. is subject to the DOT’s jurisdiction with respect to the regulation of routes and to both the DOT’s and the states’ jurisdiction with respect to the regulation of safety, insurance and hazardous materials. We are subject to similar regulation in many non-U.S. jurisdictions.
The Postal Reorganization Act of 1970 created the U.S. Postal Service as an independent establishment of the executive branch of the federal government, and created the Postal Rate Commission, an independent agency, to recommend postal rates. The Postal Accountability and Enhancement Act of 2006 amended the 1970 Act to give the re-named Postal Regulatory Commission revised oversight authority over many aspects of the Postal Service, including postal rates, product offerings and service standards. We sometimes participate in the proceedings before the Postal Regulatory Commission in an attempt to secure fair postal rates for competitive services.
Customs
We are subject to the customs laws in the countries in which we operate, regarding the import and export of shipments, including those related to the filing of documents on behalf of client importers and exporters.
Environmental
We are subject to federal, state, and local environmental laws and regulations across all of our business units. These laws and regulations cover a variety of processes, including, but not limited to: proper storage, handling, and disposal of hazardous and other waste; managing wastewater and storm water; monitoring and maintaining the integrity of underground storage tanks; complying with laws regarding clean air, including those governing emissions; protecting against and appropriately responding to spills and releases; and communicating the presence of reportable quantities of hazardous materials to local responders. UPS has established site- and activity-specific environmental compliance and pollution prevention programs to address our environmental responsibilities and remain compliant. In addition, UPS has created numerous programs which seek to minimize waste and prevent pollution within our operations.
Other Regulations
We are subject to numerous other U.S. federal and state laws and regulations, in addition to applicable foreign laws, in connection with our package and non-package businesses in the countries in which we operate. These laws and regulations include those enforced by U.S. Customs and Border Protection and other agencies of the U.S. Department of Homeland Security, the U.S. Department of Treasury, the Federal Maritime Commission, the U.S. Food and Drug Administration and the U.S. Department of Agriculture.
10
Where You Can Find More Information
We make our annual reports on Form 10-K, quarterly reports on Form 10-Q, current reports on Form 8-K, and all amendments to these reports available free of charge through our investor relations website, located at www.investors.ups.com, as soon as reasonably practicable after they are filed with or furnished to the Securities and Exchange Commission (the “SEC”).
We have adopted a written Code of Business Conduct that applies to all of our directors, officers and employees, including our principal executive officer and senior financial officers. It is available in the governance section of the investor relations website, located at www.investors.ups.com. In the event that we make changes in, or provide waivers from, the provisions of the Code of Business Conduct that the SEC requires us to disclose, we intend to disclose these events in the governance section of our investor relations website.
Our Corporate Governance Guidelines and the charters for our Audit Committee, Compensation Committee and Nominating and Corporate Governance Committee are also available in the governance section of the investor relations website.
See note 11 to our consolidated financial statements for financial information regarding our reporting segments and geographic areas in which we operate.
Additional information about UPS is available at www.ups.com. Our sustainability report, which describes our activities that support our commitment to acting responsibly and contributing to society, is available at www.sustainability.ups.com. We provide the addresses to our internet sites solely for the information of investors. We do not intend any addresses to be active links or to otherwise incorporate the contents of any website into this report.
| Item 1A. | Risk Factors |
Cautionary Statement About Forward-Looking Statements
This report includes certain “forward-looking statements” within the meaning of the Private Securities Litigation Reform Act of 1995. Statements in the future tense, and all statements accompanied by terms such as “believe,” “project,” “expect,” “estimate,” “assume,” “intend,” “anticipate,” “target,” “plan,” and variations thereof and similar terms are intended to be forward-looking statements. We intend that all forward-looking statements we make will be subject to safe harbor protection of the federal securities laws pursuant to Section 27A of the Securities Act of 1933 and Section 21E of the Securities Exchange Act of 1934.
Our disclosure and analysis in this report, in our Annual Report to Shareholders and in our other filings with the Securities and Exchange Commission contain forward-looking statements regarding our intent, belief and current expectations about our strategic direction, prospects and future results. From time to time, we also provide forward-looking statements in other materials we release as well as oral forward-looking statements. Such statements give our current expectations or forecasts of future events; they do not relate strictly to historical or current facts. Management believes that these forward-looking statements are reasonable as and when made. However, caution should be taken not to place undue reliance on any such forward-looking statements because such statements speak only as of the date when made.
Forward-looking statements are subject to certain risks and uncertainties that could cause actual results to differ materially from our historical experience and our present expectations or anticipated results. These risks and uncertainties include, but are not limited to, those described below and elsewhere in this report and those described from time to time in our future reports filed with the SEC. You should consider the limitations on, and risks associated with, forward-looking statements and not unduly rely on the accuracy of predictions contained in such forward-looking statements. We do not undertake any obligation to update forward-looking statements to reflect events, circumstances, changes in expectations, or the occurrence of unanticipated events after the date of those statements.
11
Risk Factors
You should carefully consider the following factors, which could materially affect our business, financial condition or results of operations. You should read these Risk Factors in conjunction with “Management’s Discussion and Analysis of Financial Condition and Results of Operations” in Item 7 and our Consolidated Financial Statements and related notes in Item 8. The risks described below are not the only risks facing our company. Additional risks and uncertainties not currently known to us or that we currently deem to be immaterial also may materially adversely affect our business, financial condition or results of operations.
General economic conditions, both in the U.S. and internationally, may adversely affect our results of operations.
We conduct operations in over 220 countries and territories. Our U.S. and international operations are subject to normal cycles affecting the economy in general, as well as the local economic environments in which we operate. The factors that create cyclical changes to the economy and to our business are beyond our control, and it may be difficult for us to adjust our business model to mitigate the impact of these factors. In particular, our business is affected by levels of industrial production, consumer spending and retail activity. To the extent that the recovery from the recent recession in the U.S. and in other countries takes longer than anticipated, our business, financial position and results of operations could be materially affected.
We face significant competition which could adversely affect our business, financial position and results of operations.
We face significant competition on a local, regional, national, and international basis. Our competitors include the postal services of the U.S. and other nations, various motor carriers, express companies, freight forwarders, air couriers and others. Competition may also come from other sources in the future. Some of our competitors have cost and organizational structures that differ from ours and may offer services and pricing terms that we may not be willing or able to offer. If we are unable to timely and appropriately respond to competitive pressures, our business, financial position and results of operations could be adversely affected.
The transportation industry continues to consolidate and competition remains strong. As a result of consolidation, our competitors may increase their market share and improve their financial capacity, and may strengthen their competitive positions. Business combinations could also result in competitors providing a wider variety of services and products at competitive prices, which could adversely affect our financial performance.
Our business is subject to complex and stringent regulation in the U.S. and internationally.
We are subject to complex and stringent aviation, transportation, environmental, security, labor, employment, and other governmental laws and regulations, both in the U.S. and in the other countries in which we operate. In addition, our business is impacted by laws and regulations that affect global trade, including tariff and trade policies, export requirements, taxes and other restrictions and charges. Changes in laws, regulations and the related interpretations may alter the landscape in which we do business and may affect our costs of doing business. The impact of new laws and regulations cannot be predicted. Compliance with new laws and regulations may increase our operating costs or require significant capital expenditures. Any failure to comply with applicable laws or regulations in the U.S. or in any of the countries in which we operate could result in substantial fines or possible revocation of our authority to conduct our operations, which could adversely affect our financial performance.
Increased security requirements could impose substantial costs on us and we could be the target of an attack or have a security breach.
As a result of concerns about global terrorism and homeland security, governments around the world have adopted or may adopt stricter security requirements that will result in increased operating costs for businesses in
12
the transportation industry. These requirements may change periodically as a result of regulatory and legislative requirements and in response to evolving threats. We cannot determine the effect that these new requirements will have on our cost structure or our operating results, and these rules or other future security requirements may increase our costs of operations and reduce operating efficiencies. Regardless of our compliance with security requirements or the steps we take to secure our facilities or fleet, we could be the target of an attack or security breaches could occur, which could adversely affect our operations or our reputation.
We may be affected by global climate change or by legal, regulatory or market responses to such potential change.
Concern over climate change, including the impact of global warming, has led to significant federal, state, and international legislative and regulatory efforts to limit greenhouse gas (“GHG”) emissions. For example, in the past several years, the U.S. Congress has considered various bills that would regulate GHG emissions. While these bills have not yet received sufficient Congressional support for enactment, some form of federal climate change legislation is possible in the future. Even in the absence of such legislation, the Environmental Protection Agency, spurred by judicial interpretation of the Clean Air Act, may regulate GHG emissions, especially aircraft or diesel engine emissions, and this could impose substantial costs on us. These costs include an increase in the cost of the fuel and other energy we purchase and capital costs associated with updating or replacing our aircraft or trucks prematurely. Until the timing, scope and extent of any future regulation becomes known, we cannot predict its effect on our cost structure or our operating results. Notwithstanding our widely recognized position as a leader in sustainable business practices, it is reasonably possible, however, that such legislation or regulation could impose material costs on us. Moreover, even without such legislation or regulation, increased awareness and any adverse publicity in the global marketplace about the GHGs emitted by companies in the airline and transportation industries could harm our reputation and reduce customer demand for our services, especially our air services.
Strikes, work stoppages and slowdowns by our employees could adversely affect our business, financial position and results of operations.
A significant number of our employees are employed under a national master agreement and various supplemental agreements with local unions affiliated with the International Brotherhood of Teamsters and our airline pilots, airline mechanics, ground mechanics and certain other employees are employed under other collective bargaining agreements. Strikes, work stoppages and slowdowns by our employees could adversely affect our ability to meet our customers’ needs, and customers may do more business with competitors if they believe that such actions or threatened actions may adversely affect our ability to provide services. We may face permanent loss of customers if we are unable to provide uninterrupted service, and this could adversely affect our business, financial position and results of operations. The terms of future collective bargaining agreements also may affect our competitive position and results of operations.
We are exposed to the effects of changing prices of energy, including gasoline, diesel and jet fuel, and interruptions in supplies of these commodities.
Changing fuel and energy costs may have a significant impact on our operations. We require significant quantities of fuel for our aircraft and delivery vehicles and are exposed to the risk associated with variations in the market price for petroleum products, including gasoline, diesel and jet fuel. We mitigate our exposure to changing fuel prices through our indexed fuel surcharges and we may also enter into hedging transactions from time to time. If we are unable to maintain or increase our fuel surcharges, higher fuel costs could adversely impact our operating results. Even if we are able to offset the cost of fuel with our surcharges, high fuel surcharges may result in a mix shift from our higher yielding air products to lower yielding ground products or an overall reduction in volume. If fuel prices rise sharply, even if we are successful in increasing our fuel surcharge, we could experience a lag time in implementing the surcharge, which could adversely affect our short-term operating results. There can be no assurance that our hedging transactions will be effective to protect us
13
from changes in fuel prices. Moreover, we could experience a disruption in energy supplies, including our supply of gasoline, diesel and jet fuel, as a result of war, actions by producers, or other factors which are beyond our control, which could have an adverse effect on our business.
Changes in exchange rates or interest rates may have an adverse effect on our results.
We conduct business across the globe with a significant portion of our revenue derived from operations outside the United States. Our operations in international markets are affected by changes in the exchange rates for local currencies, and in particular the Euro, British Pound and Canadian Dollar.
We are exposed to changes in interest rates, primarily on our short-term debt and that portion of our long-term debt that carries floating interest rates. The impact of a 100-basis-point change in interest rates affecting our debt is discussed in the “Quantitative and Qualitative Disclosures about Market Risk” section of this report.
We monitor and manage our exposures to changes in currency exchange rates and interest rates, and make limited use of currency exchange contracts, over the counter option contracts, commodity forwards, swaps and futures contracts to mitigate the impact of changes in currency values, but changes in exchange rates and interest rates cannot always be predicted or hedged.
If we are unable to maintain our brand image and corporate reputation, our business may suffer.
Our success depends in part on our ability to maintain the image of the UPS brand and our reputation for providing excellent service to our customers. Service quality issues, actual or perceived, even when false or unfounded, could tarnish the image of our brand and may cause customers to use other companies. Also, adverse publicity surrounding labor relations, environmental concerns, security matters, political activities and the like, or attempts to connect our company to these sorts of issues, either in the United States or other countries in which we operate, could negatively affect our overall reputation and acceptance of our services by customers. Damage to our reputation and loss of brand equity could reduce demand for our services and thus have an adverse effect on our business, financial position and results of operations, and could require additional resources to rebuild our reputation and restore the value of our brand.
A significant privacy breach could adversely affect our business and we may be required to increase our spending on data security.
The provision of service to our customers and the operation of our network involve the storage and transmission of proprietary information and sensitive or confidential data, including personal information of customers, employees and others. Breaches in security could expose us, our customers or the individuals affected to a risk of loss or misuse of this information, resulting in litigation and potential liability for the company, as well as the loss of existing or potential customers, damage to our brand and reputation, or disruptions in our operations. In addition, the cost and operational consequences of implementing further data protection measures could be significant.
We have invested in a technology infrastructure which supports our global air and ground network and is critical to support our operations and customer needs. Any major disruption to this infrastructure could adversely impact our operations, customers and global commerce.
Our ability to serve customers and to compete effectively depends to a large part upon the reliability and speed of our technology network. While we have built a multi-layered architecture to support swiftly-expanding worldwide operations and we ensure that our infrastructure is robust, reliable and redundant, there are risks of malicious or unintentional disruptions to the Internet or our technology infrastructure which could adversely impact our operations and consequently, our customers and global commerce.
14
We make significant capital investments in our business of which a significant portion is tied to projected volume levels.
We require significant capital investments in our business consisting of aircraft, vehicles, technology, facilities and sorting and other types of equipment to support both our existing business and anticipated growth. Forecasting projected volume involves many factors which are subject to uncertainty, such as general economic trends, changes in governmental regulation, and competition. If we do not accurately forecast our future capital investment needs, we could have excess capacity or insufficient capacity, either of which would negatively affect our revenues and profitability. In addition to forecasting our capital investment requirements, we adjust other elements of our operations and cost structure in response to adverse economic conditions; however, these adjustments may not be sufficient to allow us to maintain our operating margins in an adverse economy.
We derive a significant portion of our revenues from our international operations and are subject to the risks of doing business in emerging markets.
We have significant international operations and while the geographical diversity of our international operations helps ensure that we are not overly reliant on a single region or country, we are continually exposed to changing economic, political and social developments beyond our control. Emerging markets are typically more volatile than those in the developed world, and any broad-based downturn in these markets could reduce our revenues and adversely affect our business, financial position and results of operations.
We are subject to changes in markets and our business plans that have resulted, and may in the future result, in substantial write-downs of the carrying value of our assets, thereby reducing our net income.
Our regular review of the carrying value of our assets has resulted, from time to time, in significant impairments, and we may in the future be required to recognize additional impairment charges. Changes in business strategy, government regulations, or economic or market conditions have resulted and may result in further substantial impairment write-downs of our intangible or other assets at any time in the future. In addition, we have been and may be required in the future to recognize increased depreciation and amortization charges if we determine that the useful lives of our fixed assets are shorter than we originally estimated. Such changes could reduce our net income.
Employee health and retiree health and pension benefit costs represent a significant expense to us.
With approximately 400,600 employees, including approximately 330,600 in the U.S., our expenses relating to employee health and retiree health and pension benefits are significant. In recent years, we have experienced significant increases in certain of these costs, largely as a result of economic factors beyond our control, including, in particular, ongoing increases in health care costs well in excess of the rate of inflation. Continued increasing health care costs, volatility in investment returns and discount rates, as well as changes in laws, regulations and assumptions used to calculate retiree health and pension benefit expenses, may adversely affect our business, financial position, results of operations or require significant contributions to our pension plans.
We participate in a number of trustee-managed multi-employer pension and health and welfare plans for employees covered under collective bargaining agreements. Several factors could cause us to make significantly higher future contributions to these plans, including unfavorable investment performance, increases in health care costs, changes in demographics, and increased benefits to participants. At this time, we are unable to determine the amount of additional future contributions, if any, or whether any material adverse effect on our financial condition, results of operations, or liquidity could result from our participation in these plans.
We may be subject to various claims and lawsuits that could result in significant expenditures.
The nature of our business exposes us to the potential for various claims and litigation related to labor and employment, personal injury, property damage, business practices, environmental liability and other matters. Any material litigation or a catastrophic accident or series of accidents could have a material adverse effect on our business, financial position and results of operations.
15
We may not realize the anticipated benefits of acquisitions, joint ventures or strategic alliances.
As part of our business strategy, we may acquire businesses and form joint ventures or strategic alliances. Whether we realize the anticipated benefits from these transactions depends, in part, upon the successful integration between the businesses involved, the performance of the underlying operation, capabilities or technologies and the management of the transacted operations. Accordingly, our financial results could be adversely affected by our failure to effectively integrate the acquired operations, unanticipated performance issues, transaction-related charges, or charges for impairment of long-term assets that we acquire.
Insurance and claims expenses could have a material adverse effect on our business, financial condition and results of operations.
We have a combination of both self-insurance and high-deductible insurance programs for the risks arising out of the services we provide and the nature of our global operations, including claims exposure resulting from cargo loss, personal injury, property damage, aircraft and related liabilities, business interruption and workers’ compensation. Workers’ compensation, automobile and general liabilities are determined using actuarial estimates of the aggregate liability for claims incurred and an estimate of incurred but not reported claims, on an undiscounted basis. Our accruals for insurance reserves reflect certain actuarial assumptions and management judgments, which are subject to a high degree of variability. If the number or severity of claims for which we are retaining risk increases, our financial condition and results of operations could be adversely affected. If we lose our ability to self-insure these risks, our insurance costs could materially increase and we may find it difficult to obtain adequate levels of insurance coverage.
| Item 1B. | Unresolved Staff Comments |
Not applicable.
| Item 2. | Properties |
We own our headquarters, which are located in Atlanta, Georgia and consist of about 735,000 square feet of office space on an office campus, and our UPS Supply Chain Solutions group’s headquarters, which are located in Alpharetta, Georgia, and consist of about 310,000 square feet of office space.
We also own our 27 principal U.S. package operating facilities, which have floor spaces that range from about 310,000 to 693,000 square feet. In addition, we have a 1.9 million square foot operating facility near Chicago, Illinois, which is designed to streamline shipments between East Coast and West Coast destinations, and we own or lease over 1,000 additional smaller package operating facilities in the U.S. The smaller of these facilities have vehicles and drivers stationed for the pickup of packages and facilities for the sorting, transfer and delivery of packages. The larger of these facilities also service our vehicles and equipment and employ specialized mechanical installations for the sorting and handling of packages.
We own or lease almost 600 facilities that support our international package operations and an additional 776 facilities that support our freight forwarding and logistics operations. Our freight forwarding and logistics operations maintain facilities with about 31 million square feet of floor space. We own and operate a logistics campus consisting of approximately 3.1 million square feet in Louisville, Kentucky.
UPS Freight operates 196 service centers with a total of 5.6 million square feet of floor space. UPS Freight owns 140 of these service centers, while the remainder are occupied under operating lease agreements. The main offices of UPS Freight are located in Richmond, Virginia and consist of about 240,000 square feet of office space.
16
Our aircraft are operated in a hub and spokes pattern in the U.S. Our principal air hub in the U.S., known as Worldport®, is located in Louisville, Kentucky. The Worldport facility consists of over 5.2 million square feet and the site includes approximately 596 acres. In 2009, we completed the first phase of our Worldport® expansion, which increased the sorting capacity of the facility by 15%. The final phase of the Worldport® expansion was completed in 2010, and increased the sorting capacity to approximately 416,000 packages per hour. The expansion involved the addition of two aircraft load / unload wings to the hub building, followed by the installation of high-speed conveyor and computer control systems. The total cost of the expansion was over $1 billion.
We also have regional air hubs in Hartford, Connecticut; Ontario, California; Philadelphia, Pennsylvania; and Rockford, Illinois. These hubs house facilities for the sorting, transfer and delivery of packages. Our European air hub is located in Cologne, Germany, and we maintain Asia-Pacific air hubs in Shanghai, China; Shenzhen, China; Taipei, Taiwan; Hong Kong; and Singapore. Our regional air hub in Canada is located in Hamilton, Ontario, and our regional air hub for Latin America and the Caribbean is in Miami, Florida.
Over the past several years, UPS has made a successful transition to become the first wholly-owned foreign express carrier in China. In 2008, we opened the UPS International Air Hub at Pudong International Airport, which was built on a parcel totaling 2.4 million square feet with a planned sorting capacity of 17,000 packages per hour. The new hub links all of China via Shanghai to UPS’s international network with direct service to the Americas, Europe and Asia. It also connects points served in China by UPS through a dedicated service provided by Yangtze River Express, a Chinese all-cargo airline.
In February 2010, we opened a new intra-Asia air hub at Shenzhen Baoan International Airport in China. The Shenzhen facility replaced our intra-Asia air hub at Clark Air Force Base in the Philippines, and serves as our primary transit hub in Asia. The facility was built on a parcel of almost 1 million square feet, and has a sorting capacity of 18,000 packages per hour.
Our primary information technology operations are consolidated in a 435,000 square foot owned facility, the Ramapo Ridge facility, which is located on a 39-acre site in Mahwah, New Jersey. We also own a 175,000 square foot facility located on a 25-acre site in Alpharetta, Georgia, which serves as a backup to the main information technology operations facility in New Jersey. This facility provides production functions and backup capacity in the event that a power outage or other disaster incapacitates the main data center. It also helps us to meet our internal communication needs.
We believe that our facilities are adequate to support our current operations.
17
Aircraft
The following table shows information about our aircraft fleet as of December 31, 2010:
| Description |
Owned and Capital Leases |
Short-term Leased or Chartered From Others |
On Order |
Under Option |
||||||||||||
| Operating: |
||||||||||||||||
| Boeing 747-400F |
9 | — | 2 | — | ||||||||||||
| Boeing 747-400BCF |
2 | — | — | — | ||||||||||||
| Boeing 757-200 |
75 | — | — | — | ||||||||||||
| Boeing 767-300 |
39 | — | 20 | — | ||||||||||||
| Boeing MD-11 |
38 | — | — | — | ||||||||||||
| Airbus A300-600 |
53 | — | — | — | ||||||||||||
| Other |
— | 311 | — | — | ||||||||||||
| Total |
216 | 311 | 22 | — | ||||||||||||
| Held for Sale / Disposal: |
||||||||||||||||
| McDonnell-Douglas DC-8-73 |
6 | — | — | — | ||||||||||||
| Boeing 747-100 |
5 | — | — | — | ||||||||||||
| Total |
11 | — | — | — | ||||||||||||
We maintain an inventory of spare engines and parts for each aircraft.
All of the aircraft we own meet Stage III federal noise regulations and can operate at airports that have aircraft noise restrictions. We became the first major airline to successfully operate a 100% Stage III fleet more than three years in advance of the date required by federal regulations.
During 2010, we took delivery of five Boeing 767-300F aircraft. We have firm commitments to purchase 20 Boeing 767-300ER freighters to be delivered between 2011 and 2013, and two Boeing 747-400F aircraft scheduled for delivery during 2011. We sold the remainder of our McDonnell-Douglas DC-8-71 and Boeing 747-200 aircraft fleets during 2010. Additionally, one Boeing 747-400F aircraft was destroyed in an accident in September 2010.
Vehicles
We operate a ground fleet of approximately 99,800 package cars, vans, tractors and motorcycles. Our ground support fleet consists of 32,100 pieces of equipment designed specifically to support our aircraft fleet, ranging from non-powered container dollies and racks to powered aircraft main deck loaders and cargo tractors. We also have 33,800 containers used to transport cargo in our aircraft.
We promote safety throughout our operations. Our Automotive Fleet Safety Program is built with the following components:
| • | Selection. Five out of every six drivers come from our part-time ranks. Therefore, many of our new drivers are familiar with our philosophies, policies, practices and training programs. |
| • | Training. Training is the cornerstone of our Fleet Safety Program. Our approach starts with training the trainer. All trainers are certified to ensure that they have the skills and motivation to effectively train novice drivers. A new driver’s employment includes extensive classroom and on-line training as well as on-road training, followed by three safety training rides integrated into his or her training cycle. |
18
| • | Responsibility. Our operations managers are responsible for their drivers’ safety records. We investigate every accident. If we determine that an accident could have been prevented, we retrain the driver. |
| • | Preventive Maintenance. An integral part of our Fleet Safety Program is a comprehensive Preventive Maintenance Program. Our fleet is tracked electronically to ensure that each vehicle is serviced before a breakdown or accident is likely to occur. |
| • | Honor Plan. A well-defined safe driver honor plan recognizes and rewards our drivers when they achieve success. We have over 4,000 drivers who have driven for 25 years or more without an avoidable accident. |
Our workplace safety program is built upon a comprehensive health and safety process. The foundation of this process is our employee-management health and safety committees. The workplace safety process focuses on employee conditioning and safety-related habits. Our employee co-chaired health and safety committees complete comprehensive facility audits and injury analyses, and recommend facility and work process changes.
| Item 3. | Legal Proceedings |
For a discussion of legal proceedings affecting us and our subsidiaries, please see the information under the sub-caption “Contingencies” of the caption “Management’s Discussion and Analysis of Financial Condition and Results of Operations” included in this report.
| Item 4. | Submission of Matters to a Vote of Security Holders |
Reserved
19
PART II
| Item 5. | Market for Registrant’s Common Equity, Related Stockholder Matters and Issuer Purchases of Equity Securities |
Our class A common stock is not listed on a national securities exchange or traded in an organized over-the-counter market, but each share of our class A common stock is convertible into one share of our class B common stock.
The following is a summary of our class B common stock price activity and dividend information for 2010 and 2009. Our class B common stock is listed on the New York Stock Exchange under the symbol “UPS.”
| High | Low | Close | Dividends Declared |
|||||||||||||
| 2010: |
||||||||||||||||
| First Quarter |
$ | 64.95 | $ | 55.77 | $ | 64.41 | $ | 0.47 | ||||||||
| Second Quarter |
$ | 70.89 | $ | 56.70 | $ | 56.89 | $ | 0.47 | ||||||||
| Third Quarter |
$ | 69.50 | $ | 56.47 | $ | 66.69 | $ | 0.47 | ||||||||
| Fourth Quarter |
$ | 73.94 | $ | 65.44 | $ | 72.58 | $ | 0.47 | ||||||||
| 2009: |
||||||||||||||||
| First Quarter |
$ | 56.37 | $ | 37.99 | $ | 49.22 | $ | 0.45 | ||||||||
| Second Quarter |
$ | 57.89 | $ | 46.41 | $ | 49.99 | $ | 0.45 | ||||||||
| Third Quarter |
$ | 59.61 | $ | 46.78 | $ | 56.47 | $ | 0.45 | ||||||||
| Fourth Quarter |
$ | 59.75 | $ | 53.17 | $ | 57.37 | $ | 0.45 | ||||||||
As of February 9, 2011, there were 161,954 and 223,891 record holders of class A and class B common stock, respectively.
The policy of our Board of Directors is to declare dividends out of current earnings. The declaration of dividends is subject to the discretion of the Board of Directors and will depend on various factors, including our net income, financial condition, cash requirements, future prospects, and other relevant factors.
On February 3, 2011, our Board declared a dividend of $0.52 per share, which is payable on March 2, 2011 to shareowners of record on February 14, 2011. This represents an 11% increase from the previous $0.47 quarterly dividend in 2010.
In January 2008, the Board of Directors approved an increase in our share repurchase authorization to $10.0 billion. Share repurchases may take the form of accelerated share repurchases, open market purchases, or other such methods as we deem appropriate. The timing of our share repurchases will depend upon market conditions. Unless terminated earlier by the resolution of our Board, the program will expire when we have purchased all shares authorized for repurchase under the program.
A summary of repurchases of our class A and class B common stock during the fourth quarter of 2010 is as follows (in millions, except per share amounts):
| Total Number of Shares Purchased(1) |
Average Price Paid Per Share(1) |
Total Number of Shares Purchased as Part of Publicly Announced Program |
Approximate Dollar Value of Shares that May Yet be Purchased Under the Program (as of month-end) |
|||||||||||||
| October 1—October 31 |
1.2 | $ | 74.43 | 1.0 | $ | 5,342 | ||||||||||
| November 1—November 30 |
1.4 | 67.09 | 1.2 | 5,259 | ||||||||||||
| December 1—December 31 |
1.3 | 72.16 | 0.9 | 5,194 | ||||||||||||
| Total October 1—December 31 |
3.9 | $ | 70.86 | 3.1 | ||||||||||||
| (1) | Includes shares repurchased through our publicly announced share repurchase program and shares tendered to pay the exercise price and tax withholding on employee stock options. |
20
Shareowner Return Performance Graph
The following performance graph and related information shall not be deemed “soliciting material” or to be “filed” with the Securities and Exchange Commission, nor shall such information be incorporated by reference into any future filing under the Securities Act of 1933 or Securities Exchange Act of 1934, each as amended, except to the extent that the Company specifically incorporates such information by reference into such filing.
The following graph shows a five year comparison of cumulative total shareowners’ returns for our class B common stock, the Standard & Poor’s 500 Index, and the Dow Jones Transportation Average. The comparison of the total cumulative return on investment, which is the change in the quarterly stock price plus reinvested dividends for each of the quarterly periods, assumes that $100 was invested on December 31, 2005 in the Standard & Poor’s 500 Index, the Dow Jones Transportation Average, and our class B common stock.
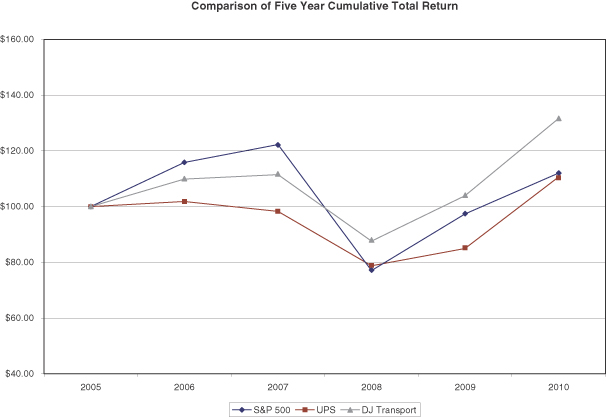
| 12/31/05 | 12/31/06 | 12/31/07 | 12/31/08 | 12/31/09 | 12/31/10 | |||||||||||||||||||
| United Parcel Service, Inc. |
$ | 100.00 | $ | 101.76 | $ | 98.20 | $ | 78.76 | $ | 84.87 | $ | 110.57 | ||||||||||||
| Standard & Poor’s 500 Index |
$ | 100.00 | $ | 115.79 | $ | 122.16 | $ | 76.96 | $ | 97.33 | $ | 111.99 | ||||||||||||
| Dow Jones Transportation Average |
$ | 100.00 | $ | 109.82 | $ | 111.38 | $ | 87.52 | $ | 103.79 | $ | 131.59 | ||||||||||||
21
| Item 6. | Selected Financial Data |
The following table sets forth selected financial data for each of the five years in the period ended December 31, 2010 (in millions, except per share amounts). This financial data should be read together with our consolidated financial statements and related notes, Management’s Discussion and Analysis of Financial Condition and Results of Operations, and other financial data appearing elsewhere in this report.
| Years Ended December 31, | ||||||||||||||||||||
| 2010 | 2009 | 2008 | 2007 | 2006 | ||||||||||||||||
| Selected Income Statement Data |
||||||||||||||||||||
| Revenue: |
||||||||||||||||||||
| U.S. Domestic Package |
$ | 29,742 | $ | 28,158 | $ | 31,278 | $ | 30,985 | $ | 30,456 | ||||||||||
| International Package |
11,133 | 9,699 | 11,293 | 10,281 | 9,089 | |||||||||||||||
| Supply Chain & Freight |
8,670 | 7,440 | 8,915 | 8,426 | 8,002 | |||||||||||||||
| Total revenue |
49,545 | 45,297 | 51,486 | 49,692 | 47,547 | |||||||||||||||
| Operating expenses: |
||||||||||||||||||||
| Compensation and benefits |
26,324 | 25,640 | 26,063 | 31,745 | 24,421 | |||||||||||||||
| Other |
17,347 | 15,856 | 20,041 | 17,369 | 16,491 | |||||||||||||||
| Total operating expenses |
43,671 | 41,496 | 46,104 | 49,114 | 40,912 | |||||||||||||||
| Operating profit (loss): |
||||||||||||||||||||
| U.S. Domestic Package |
3,373 | 2,138 | 3,907 | (1,531 | ) | 4,923 | ||||||||||||||
| International Package |
1,904 | 1,367 | 1,580 | 1,831 | 1,710 | |||||||||||||||
| Supply Chain and Freight |
597 | 296 | (105 | ) | 278 | 2 | ||||||||||||||
| Total operating profit |
5,874 | 3,801 | 5,382 | 578 | 6,635 | |||||||||||||||
| Other income (expense): |
||||||||||||||||||||
| Investment income |
3 | 10 | 75 | 99 | 86 | |||||||||||||||
| Interest expense |
(354 | ) | (445 | ) | (442 | ) | (246 | ) | (211 | ) | ||||||||||
| Income before income taxes |
5,523 | 3,366 | 5,015 | 431 | 6,510 | |||||||||||||||
| Income tax expense |
(2,035 | ) | (1,214 | ) | (2,012 | ) | (49 | ) | (2,308 | ) | ||||||||||
| Net income |
$ | 3,488 | $ | 2,152 | $ | 3,003 | $ | 382 | $ | 4,202 | ||||||||||
| Per share amounts: |
||||||||||||||||||||
| Basic earnings per share |
$ | 3.51 | $ | 2.16 | $ | 2.96 | $ | 0.36 | $ | 3.87 | ||||||||||
| Diluted earnings per share |
$ | 3.48 | $ | 2.14 | $ | 2.94 | $ | 0.36 | $ | 3.86 | ||||||||||
| Dividends declared per share |
$ | 1.88 | $ | 1.80 | $ | 1.80 | $ | 1.68 | $ | 1.52 | ||||||||||
| Weighted average shares outstanding: |
||||||||||||||||||||
| Basic |
994 | 998 | 1,016 | 1,057 | 1,085 | |||||||||||||||
| Diluted |
1,003 | 1,004 | 1,022 | 1,063 | 1,089 | |||||||||||||||
| As of December 31, | ||||||||||||||||||||
| 2010 | 2009 | 2008 | 2007 | 2006 | ||||||||||||||||
| Selected Balance Sheet Data |
||||||||||||||||||||
| Cash and marketable securities |
$ | 4,081 | $ | 2,100 | $ | 1,049 | $ | 2,604 | $ | 1,983 | ||||||||||
| Total assets |
33,597 | 31,883 | 31,879 | 39,042 | 33,210 | |||||||||||||||
| Long-term debt |
10,491 | 8,668 | 7,797 | 7,506 | 3,133 | |||||||||||||||
| Shareowners’ equity |
8,047 | 7,696 | 6,780 | 12,183 | 15,482 | |||||||||||||||
22
| Item 7. | Management’s Discussion and Analysis of Financial Condition and Results of Operations |
Overview
Our U.S. Domestic Package, International Package, and Supply Chain & Freight segments were all positively affected by the worldwide economic recovery in 2010. Our operating results had deteriorated in 2008 and 2009, due to the severity and length of the economic recession. Growth in world trade, U.S. industrial production and retail sales positively impacted volume in our package delivery, LTL and forwarding operations in 2010. Additionally, cost containment initiatives and better network efficiencies resulted in improving operating profit margins for our small package operations. Our consolidated results are presented in the table below:
| Year Ended December 31, | % Change | |||||||||||||||||||
| 2010 | 2009 | 2008 | 2010 /2009 |
2009 /2008 | ||||||||||||||||
| Revenue (in millions) |
$ | 49,545 | $ | 45,297 | $ | 51,486 | 9.4 | % | (12.0 | )% | ||||||||||
| Operating Expenses (in millions) |
43,671 | 41,496 | 46,104 | 5.2 | % | (10.0 | )% | |||||||||||||
| Operating Profit (in millions) |
$ | 5,874 | $ | 3,801 | $ | 5,382 | 54.5 | % | (29.4 | )% | ||||||||||
| Operating Margin |
11.9 | % | 8.4 | % | 10.5 | % | ||||||||||||||
| Average Daily Package Volume (in thousands) |
15,574 | 15,064 | 15,539 | 3.4 | % | (3.1 | )% | |||||||||||||
| Average Revenue Per Piece |
$ | 10.24 | $ | 9.83 | $ | 10.70 | 4.2 | % | (8.1 | )% | ||||||||||
| Net Income (in millions) |
$ | 3,488 | $ | 2,152 | $ | 3,003 | 62.1 | % | (28.3 | )% | ||||||||||
| Basic Earnings Per Share |
$ | 3.51 | $ | 2.16 | $ | 2.96 | 62.5 | % | (27.0 | )% | ||||||||||
| Diluted Earnings Per Share |
$ | 3.48 | $ | 2.14 | $ | 2.94 | 62.6 | % | (27.2 | )% | ||||||||||
Items Affecting Comparability
The year-over-year comparisons of our financial results are affected by the following items (in millions):
| Year Ended December 31, | ||||||||||||
| 2010 | 2009 | 2008 | ||||||||||
| Operating Expenses: |
||||||||||||
| Restructuring Charge |
$ | 98 | $ | — | $ | — | ||||||
| Gain on Sales of Businesses |
(20 | ) | — | — | ||||||||
| Gain on Sale of Real Estate |
(109 | ) | — | — | ||||||||
| Aircraft Impairment Charge |
— | 181 | — | |||||||||
| Goodwill Impairment Charge |
— | — | 548 | |||||||||
| Intangible Impairment Charge |
— | — | 27 | |||||||||
| Interest Expense: |
||||||||||||
| Currency Remeasurement Charge |
— | 77 | — | |||||||||
| Income Tax Expense (Benefit) from the Items Above |
37 | (94 | ) | — | ||||||||
| Charge for Change in Tax Filing Status for German Subsidiary |
76 | — | — | |||||||||
Restructuring Charge
In 2010, we streamlined the management structure in our U.S. Domestic Package segment, and incurred a restructuring charge associated with this reorganization. This pre-tax charge totaled $98 million ($64 million after-tax), and reflects the value of voluntary retirement benefits, severance benefits and unvested stock compensation.
23
Gain on Sales of Businesses
In 2010, we sold our UPS Logistics Technologies business unit within our Supply Chain & Freight segment, and recognized a pre-tax gain of $71 million ($44 million after-tax). Also in 2010, we sold a specialized transportation business in Germany within our Supply Chain & Freight segment, and incurred a pre-tax loss on the sale of $51 million ($47 million after-tax), which includes a fair value adjustment loss due to a financial guarantee associated with this business sale.
Gain on Sale of Real Estate
In 2010, we recognized a pre-tax gain of $109 million ($61 million after-tax) on the sale of real estate within our U.S. Domestic Package segment.
Aircraft Impairment Charges
In 2009, we completed an impairment assessment of our McDonnell-Douglas DC-8 aircraft fleet, and recorded an impairment charge of $181 million, which affected our U.S. Domestic Package segment. This charge, as well as our accounting policies pertaining to long-lived assets, is discussed further in “Critical Accounting Policies and Estimates”.
Goodwill Impairment Charge
In 2008, we completed our annual goodwill impairment testing and determined that our UPS Freight reporting unit, which was formed through the acquisition of Overnite Corporation in 2005, had a goodwill impairment of $548 million. This charge, as well as our accounting policies pertaining to goodwill, is discussed further in “Critical Accounting Policies and Estimates”.
Intangible Impairment Charge
In 2008, we completed an impairment assessment on a customer list intangible asset related to our domestic package entity in the United Kingdom. We recorded a $27 million charge related to this assessment, which is further discussed in “Critical Accounting Policies and Estimates”.
Currency Remeasurement Charge
During 2009, we incurred a $77 million non-cash, pre-tax currency remeasurement charge on certain foreign currency denominated obligations.
Charge for Change in Tax Filing Status for German Subsidiary
In 2010, we changed the tax status of a German subsidiary that was taxable in the U.S. and its local jurisdiction to one that is solely taxed in its local jurisdiction. As a result of this change in tax status, we recorded a non-cash charge of $76 million to income tax expense, which resulted primarily from the write-off of related deferred tax assets which will not be realizable following the change in tax status.
Results of Operations—Segment Review
The results and discussions that follow are reflective of how our executive management monitors the performance of our reporting segments. We supplement the reporting of our financial information determined under generally accepted accounting principles (“GAAP”) with certain non-GAAP financial measures, including operating profit, operating margin, pre-tax income, net income and earnings per share adjusted for the non-comparable items discussed previously. We believe that these adjusted measures provide meaningful information to assist investors and analysts in understanding our financial results and assessing our prospects for
24
future performance. We believe these adjusted financial measures are important indicators of our recurring results of operations because they exclude items that may not be indicative of, or are unrelated to, our core operating results, and provide a better baseline for analyzing trends in our underlying businesses.
U.S. Domestic Package Operations
| Year Ended December 31, | % Change | |||||||||||||||||||
| 2010 | 2009 | 2008 | 2010 / 2009 | 2009 / 2008 | ||||||||||||||||
| Revenue (in millions): |
||||||||||||||||||||
| Next Day Air |
$ | 5,835 | $ | 5,456 | $ | 6,559 | 6.9 | % | (16.8 | )% | ||||||||||
| Deferred |
2,975 | 2,859 | 3,325 | 4.1 | % | (14.0 | )% | |||||||||||||
| Ground |
20,932 | 19,843 | 21,394 | 5.5 | % | (7.2 | )% | |||||||||||||
| Total Revenue |
$ | 29,742 | $ | 28,158 | $ | 31,278 | 5.6 | % | (10.0 | )% | ||||||||||
| Average Daily Package Volume (in thousands): |
||||||||||||||||||||
| Next Day Air |
1,205 | 1,198 | 1,186 | 0.6 | % | 1.0 | % | |||||||||||||
| Deferred |
941 | 957 | 947 | (1.7 | )% | 1.1 | % | |||||||||||||
| Ground |
11,140 | 10,895 | 11,443 | 2.2 | % | (4.8 | )% | |||||||||||||
| Total Avg. Daily Package Volume |
13,286 | 13,050 | 13,576 | 1.8 | % | (3.9 | )% | |||||||||||||
| Average Revenue Per Piece: |
||||||||||||||||||||
| Next Day Air |
$ | 19.14 | $ | 18.00 | $ | 21.95 | 6.3 | % | (18.0 | )% | ||||||||||
| Deferred |
12.50 | 11.81 | 13.93 | 5.8 | % | (15.2 | )% | |||||||||||||
| Ground |
7.43 | 7.20 | 7.42 | 3.2 | % | (3.0 | )% | |||||||||||||
| Total Avg. Revenue Per Piece |
$ | 8.85 | $ | 8.53 | $ | 9.14 | 3.8 | % | (6.7 | )% | ||||||||||
| Operating Profit (in millions): |
||||||||||||||||||||
| Operating Profit |
$ | 3,373 | $ | 2,138 | $ | 3,907 | 57.8 | % | (45.3 | )% | ||||||||||
| Impact of Restructuring Charge |
98 | — | — | |||||||||||||||||
| Impact of Gain on Sale of Real Estate |
(109 | ) | — | — | ||||||||||||||||
| Impact of Aircraft Impairment Charge |
— | 181 | — | |||||||||||||||||
| Adjusted Operating Profit |
$ | 3,362 | $ | 2,319 | $ | 3,907 | 45.0 | % | (40.6 | )% | ||||||||||
| Operating Margin |
11.3 | % | 7.6 | % | 12.5 | % | ||||||||||||||
| Adjusted Operating Margin |
11.3 | % | 8.2 | % | 12.5 | % | ||||||||||||||
| Operating Days in Period |
253 | 253 | 252 | |||||||||||||||||
Volume
2010 compared to 2009
In 2010, our overall volume increased as improvements in industrial production and retail sales increased overall demand in the U.S. small package market. Among our air products, package volume increased as inventory rebuilding in the manufacturing and retailing sectors contributed to growth. However, our letter volume declined largely due to weakness in the financial and other service industries. The growth in ground volume was driven by increased volume from the manufacturing and retailing sectors.
2009 compared to 2008
In 2009, our overall volume declined as decreases in industrial production and retail sales reduced overall demand in the U.S. small package market. Our air product volume was stronger than our ground volume, as our air volume benefited from market share gains resulting from the departure of a competitor in the U.S. market, as well as improving economic trends in the latter half of the year. The growth in air volume was strongest in our less time-sensitive products, such as Next Day Air Saver and Three Day Select.
25
Volume trends improved in the fourth quarter, largely as a result of overall economic improvements, as average daily volume for Next Day Air and Deferred products increased 2.8% and 4.3%, respectively, over 2008 levels. Ground volume demonstrated an improving trend over the previous quarters despite a 2.9% decline in the fourth quarter compared with 2008.
Revenue Per Piece
2010 compared to 2009
Overall revenue per piece increased for our ground and air products in 2010, largely due to a combination of base price increases and fuel surcharge rate changes, which are discussed further below. The revenue per piece for our air products also improved as a result of higher average package weights and the overall mix shift from letters to packages. For both our air and ground products, revenue per piece was negatively affected by a shift in product mix to our less premium services, such as Next Day Air Saver and Ground Basic.
Revenue per piece for our ground and air products was impacted by an increase in base rates that took effect on January 4, 2010. We increased the base rates 6.9% on UPS Next Day Air, UPS 2nd Day Air, and UPS 3 Day Select, and 4.9% on UPS Ground. Other pricing changes included an increase in the residential surcharge, and an increase in the delivery area surcharge on both residential and commercial services to certain ZIP codes. These rate changes are customary and occur on an annual basis.
2009 compared to 2008
Revenue per piece for our air products was negatively affected in 2009 by a decline in the fuel surcharge rate for air products. Additionally, the revenue per piece decline for our air products was impacted by lower average package weights and a mix shift toward lower yielding products, reflecting the economic recession in the United States. The decline in revenue per piece for our ground products was primarily due to a decrease in the fuel surcharge rate, but was also impacted by lower average package weights.
The factors decreasing revenue per piece for our ground and air products were partially offset by an increase in base rates that took effect on January 5, 2009. We increased the base rates 6.9% on UPS Next Day Air, UPS 2nd Day Air, and UPS 3 Day Select, and 5.9% on UPS Ground. Other pricing changes included an increase in the residential surcharge, and an increase in the delivery area surcharge on both residential and commercial services to certain ZIP codes.
The trend towards lower package weights began to stabilize in the fourth quarter, however product mix within our air and ground services continued to adversely impact revenue per piece, as the lower-yielding products within those categories represented a larger share of our overall package volume.
Fuel Surcharges
UPS applies a fuel surcharge on our domestic air and ground services. The air fuel surcharge is based on the U.S. Energy Department’s Gulf Coast spot price for a gallon of kerosene-type jet fuel, while the ground fuel surcharge is based on the U.S. Energy Department’s On-Highway Diesel Fuel Price. Based on published rates, the average fuel surcharge for domestic air and ground products was as follows:
| Year Ended December 31, | % Point Change | |||||||||||||||||||
| 2010 | 2009 | 2008 | 2010 / 2009 | 2009 / 2008 | ||||||||||||||||
| Next Day Air / Deferred |
8.0 | % | 4.0 | % | 25.2 | % | 4.0 | % | (21.2 | )% | ||||||||||
| Ground |
5.6 | % | 3.3 | % | 8.0 | % | 2.3 | % | (4.7 | )% | ||||||||||
On January 4, 2010 and January 5, 2009, we modified the fuel surcharge on air services by reducing the index used to determine the fuel surcharge by 2% in each of the two years. The 2010 increase and 2009 decrease in the air and ground fuel surcharges are due to the significant variations in jet and diesel fuel prices (in addition to the reduction in the index on the air surcharge). Total domestic fuel surcharge revenue, net of the impact of hedging, increased by $592 million in 2010, primarily due to the higher fuel surcharge rates described above, as
26
well as the increase in volume for our air and ground products. In 2009, fuel surcharge revenue decreased by $1.924 billion due to lower fuel surcharge rates and the decline in volume for our air and ground products.
Operating Profit and Margin
2010 compared to 2009
Operating profit in 2010 was positively impacted by the overall economic growth in the U.S., which drove increased volume and yields. Combined with increased network efficiencies and cost containment initiatives, this resulted in strong operating leverage. Network efficiencies were achieved in 2010, as we adjusted our air and ground networks to better match volume levels, and utilized our expanded Worldport facility to utilize larger aircraft as well as increase package sorting efficiency. These changes have resulted in cost savings through fewer aircraft block hours, labor hours in our operations, and vehicle miles driven. Improved pick-up and delivery densities have also increased productivity in our operations. In addition to these factors, management salary costs declined as a result of a decrease in the total number of management employees through attrition combined with voluntary and involuntary workforce reductions. The combination of these factors led to an increase in the operating margin in 2010 compared with 2009.
2009 compared to 2008
Operating profit in 2009 was adversely impacted by the U.S. economic recession, decreased network efficiencies due to the decline in volume, changes in package characteristics, and a shift in product mix away from our premium services. Operating profit was also negatively impacted as we incurred a larger decline in fuel surcharge revenue compared with the decline in fuel expense. We adjusted our air and ground networks to better match these lower volume levels, as well as reduced labor hours and employee headcount, resulting in cost savings. Operating profit trends improved during the fourth quarter of 2009 due to both improving volume trends and the positive impact of continued cost and production efficiencies, which combined to improve the operating margin to 10.1% for the quarter.
International Package Operations
| Year Ended December 31, | % Change | |||||||||||||||||||
| 2010 | 2009 | 2008 | 2010 / 2009 | 2009 / 2008 | ||||||||||||||||
| Revenue (in millions): |
||||||||||||||||||||
| Domestic |
$ | 2,365 | $ | 2,111 | $ | 2,344 | 12.0 | % | (9.9 | )% | ||||||||||
| Export |
8,234 | 7,176 | 8,294 | 14.7 | % | (13.5 | )% | |||||||||||||
| Cargo |
534 | 412 | 655 | 29.6 | % | (37.1 | )% | |||||||||||||
| Total Revenue |
$ | 11,133 | $ | 9,699 | $ | 11,293 | 14.8 | % | (14.1 | )% | ||||||||||
| Average Daily Package Volume (in thousands): |
||||||||||||||||||||
| Domestic |
1,403 | 1,218 | 1,150 | 15.2 | % | 5.9 | % | |||||||||||||
| Export |
885 | 796 | 813 | 11.2 | % | (2.1 | )% | |||||||||||||
| Total Avg. Daily Package Volume |
2,288 | 2,014 | 1,963 | 13.6 | % | 2.6 | % | |||||||||||||
| Average Revenue Per Piece: |
||||||||||||||||||||
| Domestic |
$ | 6.66 | $ | 6.85 | $ | 8.09 | (2.8 | )% | (15.3 | )% | ||||||||||
| Export |
36.77 | 35.63 | 40.48 | 3.2 | % | (12.0 | )% | |||||||||||||
| Total Avg. Revenue Per Piece |
$ | 18.31 | $ | 18.23 | $ | 21.50 | 0.4 | % | (15.2 | )% | ||||||||||
| Operating Profit (in millions): |
||||||||||||||||||||
| Operating Profit |
$ | 1,904 | $ | 1,367 | $ | 1,580 | 39.3 | % | (13.5 | )% | ||||||||||
| Impact of Intangible Impairment Charge |
— | — | 27 | |||||||||||||||||
| Adjusted Operating Profit |
$ | 1,904 | $ | 1,367 | $ | 1,607 | 39.3 | % | (14.9 | )% | ||||||||||
| Operating Margin |
17.1 | % | 14.1 | % | 14.0 | % | ||||||||||||||
| Adjusted Operating Margin |
17.1 | % | 14.1 | % | 14.2 | % | ||||||||||||||
| Operating Days in Period |
253 | 253 | 252 | |||||||||||||||||
| Currency Translation Benefit / (Cost)—(in millions)*: |
||||||||||||||||||||
| Revenue |
$ | (24 | ) | $ | (376 | ) | ||||||||||||||
| Operating Profit |
6 | (23 | ) | |||||||||||||||||
| * | Net of currency hedging; amount represents the change compared to the prior year. |
27
Volume
2010 compared to 2009
Export volume increased for 2010, as the worldwide economy and world trade continued to improve. We experienced strong growth in Asia, where volume grew 28% due to a combination of regional economic growth and geographic expansion of our service offerings. European export volume also had strong growth for the year, increasing 10% compared with the prior year, due to market share gains, economic growth in certain key markets, and an overall expansion of trade in the European Union. U.S. origin export volume also had solid growth during the year. Our premium Worldwide Express and Expedited products grew at a relatively faster rate than our standard transborder and trade direct products.
Non-U.S. domestic volume increased 15.2% for the year, due in part to the acquisition of Unsped Paket Servisi San ve Ticaret A.S. (“Unsped”) in Turkey in the third quarter of 2009. Excluding the acquisition of Unsped, non-U.S. domestic volume increased 9.7%, led by the strength in core European markets, Canada and Mexico.
2009 compared to 2008
Export volume declined, primarily due to weakness in the Asia, Europe and U.S. export lanes, as the worldwide economic recession and slowdown in world trade more than offset market share gains. Transborder export volume was relatively stronger within the European Union and North America trade areas, while volume in the longer export trade lanes was comparatively weaker. Non-U.S. domestic volume increased for the year, largely due to the acquisition of Unsped, as well as volume growth in Germany, France, Poland and Canada.
By the fourth quarter of 2009, export volume began to improve as global trade and economic activity accelerated. The Asia and U.S. export lanes demonstrated significant improvement, as those trade areas suffered a relatively greater decline in the early part of the year. Domestic volume continued to benefit from the Unsped acquisition, as well as market share gains and general economic improvement in Europe and the Americas. Volume was relatively stronger in the small and middle market customer segments.
Revenue Per Piece
2010 compared to 2009
Export revenue per piece increased during 2010, largely due to higher fuel surcharge rates, base rate increases and product mix. Export revenue per piece increased as higher-yielding products (such as Worldwide Express and Worldwide Expedited) grew at a relatively faster pace. In 2010, we experienced an overall lengthening of trade lanes, as inter-regional trade increased (especially in our Asia-to-Europe and Asia-to-U.S. export lanes), leading to relatively stronger growth for our premium products. The impact of currency, net of hedging, resulted in a decrease to revenue growth during the year. Domestic revenue per piece decreased, primarily due to the impact of lower-yielding domestic packages from the Unsped acquisition. Total average revenue per piece increased 0.7% for the year on a currency-adjusted basis.
On January 4, 2010, we increased the base rates 6.9% for international shipments originating in the United States (Worldwide Express, Worldwide Express Plus, UPS Worldwide Expedited and UPS International Standard service). Rate changes for shipments originating outside the U.S. were made throughout the year and varied by geographic market.
2009 compared to 2008
Export revenue per piece decreased, largely due to the adverse impact of currency exchange rates, lower fuel surcharge rates, and product mix, but was partially offset by base rate increases that took effect in the first
28
quarter of 2009. Currency-adjusted export revenue per piece declined 10.1% for 2009. Export revenue per piece was impacted by the lower revenue per piece transborder products comprising a relatively larger portion of our total volume, as we experienced larger volume declines on some of our longer export trade lanes with higher yields. Domestic revenue per piece decreased, which was primarily caused by adverse currency exchange rate fluctuations (currency-adjusted domestic revenue per piece declined 7.2% for the year), as well as the impact of lower fuel surcharge rates. Total average revenue per piece decreased 12.1% for the year on a currency-adjusted basis.
On January 5, 2009, we increased the base rates 6.9% for international shipments originating in the United States (Worldwide Express, Worldwide Express Plus, UPS Worldwide Expedited and UPS International Standard service). Rate changes for shipments originating outside the U.S. were made throughout the year and varied by geographic market.
Export revenue per piece showed a significant improvement in the fourth quarter, as higher-yielding trade lanes, such as Asia to Europe and Asia to North America, comprised a larger proportion of our total export volume. Revenue per piece in the fourth quarter benefited from a weaker U.S. Dollar, but continued to be adversely impacted by lower fuel surcharge rates.
Fuel Surcharges
On January 4, 2010 and January 5, 2009, we modified the fuel surcharge on certain U.S.-related international air services by reducing the index used to determine the fuel surcharge by 2% in each of the two years. The fuel surcharges for products originating outside the United States continue to be indexed to fuel prices in our different international regions, depending upon where the shipment takes place. Total international fuel surcharge revenue increased by $299 million in 2010, due to higher fuel surcharge rates caused by increased fuel prices as well as an increase in international air volume. Fuel surcharge revenue decreased by $788 million in 2009, due to lower fuel surcharge rates caused by decreased fuel prices, but this was partially offset by an increase in international air volume.
Operating Profit and Margin
2010 compared to 2009
The increase in operating profit for 2010 was primarily driven by volume increases in all major regions and trade lanes worldwide. The shift in product mix to our higher-margin premium services also contributed to the increase in operating profits. Additionally, network efficiencies and cost containment initiatives created operating leverage throughout our operations. These factors led to an increase in the operating margin in 2010 compared with 2009.
2009 compared to 2008
The decline in operating profit for the year was caused primarily by a shift in product mix away from our premium services, and volume declines in some of the longer export trade lanes. Operating profit was also negatively impacted as we incurred a larger decline in fuel surcharge revenue compared with the decline in fuel expense. To reduce costs, we adjusted our air network and reduced block hours and flight segments in certain international regions. The volume trends began to improve later in the year, and in the fourth quarter operating profit increased 19% (excluding an impairment charge in 2008), as the impact of cost initiatives and network improvements drove an improvement in the operating margin to 16.7%.
29
Supply Chain & Freight Operations
| Year Ended December 31, | % Change | |||||||||||||||||||
| 2010 | 2009 | 2008 | 2010 / 2009 | 2009 / 2008 | ||||||||||||||||
| Revenue (in millions): |
||||||||||||||||||||
| Forwarding and Logistics |
$ | 6,022 | $ | 5,080 | $ | 6,293 | 18.5 | % | (19.3 | )% | ||||||||||
| Freight |
2,208 | 1,943 | 2,191 | 13.6 | % | (11.3 | )% | |||||||||||||
| Other |
440 | 417 | 431 | 5.5 | % | (3.2 | )% | |||||||||||||
| Total Revenue |
$ | 8,670 | $ | 7,440 | $ | 8,915 | 16.5 | % | (16.5 | )% | ||||||||||
| Freight LTL Statistics: |
||||||||||||||||||||
| Revenue (in millions) |
$ | 2,002 | $ | 1,807 | $ | 2,062 | 10.8 | % | (12.4 | )% | ||||||||||
| Revenue Per Hundredweight |
$ | 19.18 | $ | 17.69 | $ | 18.68 | 8.4 | % | (5.3 | )% | ||||||||||
| Shipments (in thousands) |
9,952 | 9,880 | 10,036 | 0.7 | % | (1.6 | )% | |||||||||||||
| Shipments Per Day (in thousands) |
39.5 | 39.1 | 39.5 | 1.0 | % | (1.0 | )% | |||||||||||||
| Gross Weight Hauled (in millions of lbs) |
10,440 | 10,211 | 11,037 | 2.2 | % | (7.5 | )% | |||||||||||||
| Weight Per Shipment (in lbs) |
1,049 | 1,033 | 1,100 | 1.5 | % | (6.1 | )% | |||||||||||||
| Operating Days in Period |
252 | 253 | 254 | |||||||||||||||||
| Operating Profit (in millions): |
||||||||||||||||||||
| Operating Profit |
$ | 597 | $ | 296 | $ | (105 | ) | 101.7 | % | N/A | ||||||||||
| Impact of Gain on Sales of Businesses |
(20 | ) | — | — | ||||||||||||||||
| Impact of Goodwill Impairment Charge |
— | — | 548 | |||||||||||||||||
| Adjusted Operating Profit |
$ | 577 | $ | 296 | $ | 443 | 94.9 | % | (33.2 | )% | ||||||||||
| Operating Margin |
6.9 | % | 4.0 | % | (1.2 | )% | ||||||||||||||
| Adjusted Operating Margin |
6.7 | % | 4.0 | % | 5.0 | % | ||||||||||||||
| Currency Translation Benefit / (Cost)—(in millions)*: |
||||||||||||||||||||
| Revenue |
$ | 48 | $ | (52 | ) | |||||||||||||||
| Operating Profit |
7 | (15 | ) | |||||||||||||||||
| * | Amount represents the change compared to the prior year. |
Revenue
2010 compared to 2009
Forwarding and logistics revenue increased in 2010, primarily due to growth in the demand for forwarding as a result of the continued expansion of the worldwide economy, inventory rebuilding and world trade. In our forwarding business, both air freight and ocean freight experienced solid revenue growth, due primarily to higher volumes, fuel surcharges, and other accessorial charges. International air freight tonnage increased 19% for 2010 compared with the prior year. In our logistics products, we experienced growth in mail services and distribution revenue, with solid increases being achieved in the healthcare and technology sectors.
Freight revenue increased, primarily due to higher fuel surcharge rates and a base rate increase that took effect in January 2010. Average LTL shipments per day, weight per shipment and LTL revenue per hundredweight all increased during the year, largely due to our strategy of maintaining our focus on yields and targeting certain customer segments. The increase in LTL revenue per hundredweight was primarily due to an increase in base prices that took effect in January 2010, as UPS Freight increased minimum charge, LTL and TL rates an average of 5.7%, covering non-contractual shipments in the United States, Canada, and Mexico. An additional 5.9% rate increase took effect October 18, 2010. Additionally, LTL revenue per hundredweight increased as a result of higher fuel surcharge rates, as total fuel surcharge revenue increased $105 million for the year primarily resulting from higher diesel fuel prices.
30
The other businesses within Supply Chain & Freight experienced an increase in revenue. A primary driver of this increase was our UPS Customer Solutions business, which provides a range of services (e.g. project management, industrial engineering, transportation fleet services, distribution network analysis, package engineering, and package visibility).
2009 compared to 2008
Forwarding and logistics revenue decreased for the year, and was caused primarily by weakness in demand for freight forwarding due to global economic weakness and declines in international trade. Forwarding revenue declined in all major transportation modes, including domestic and international air freight and ocean freight, and was impacted by lower volumes, lower fuel surcharges, and lower security and other accessorial charges. Logistics distribution and post-sales service revenue also declined, primarily resulting from the weak global economy, however mail services revenue increased for the year.
Freight revenue declined, primarily due to lower fuel surcharge rates and a decline in average daily LTL shipments. Total LTL weight per shipment declined for the year, reflecting the weak LTL market and the ongoing economic recession in the United States in 2009. Average LTL shipments per day also declined, as market share gains were more than offset by the impact of the weak economy. LTL revenue per hundredweight decreased, primarily as a result of the lower fuel surcharge rates, as total fuel surcharge revenue declined $188 million for the year primarily resulting from lower diesel fuel prices. However, this decline was partially offset by an increase in base prices that took effect on January 5, 2009, as UPS Freight increased minimum charge, LTL and TL rates an average of 5.9%, covering non-contractual shipments in the United States and Canada.
The other businesses within Supply Chain & Freight, which include our retail franchising business and our financial business, experienced a decline in revenue, primarily caused by lower interest rates and decreased loan volume in our financial business.
Revenue trends for our forwarding, logistics, and LTL products improved in the fourth quarter of 2009, largely resulting from favorable comparisons with the prior year. The change in revenue for our forwarding and logistics businesses benefited from the weaker U.S. Dollar during the quarter, while revenue in the forwarding and LTL units continued to be adversely impacted by lower fuel surcharge revenue.
Operating Profit and Margin
2010 compared to 2009
Operating profit in the forwarding unit increased during 2010, largely due to a strong increase in tonnage in our air and ocean forwarding businesses, but was partially offset by capacity constraints from outside carriers in the first half of 2010. Capacity constraints led to rapidly escalating rates on air freight which could not be passed on to customers in a timely manner, resulting in a negative impact to our operating profit and margin. This situation improved during the second half of 2010, as capacity constraints lessened and we were able to implement revenue management plans which better matched customer pricing with market conditions. Our logistics unit had a solid increase in profitability for the year, which was driven primarily by an expansion of operating margins due to operating efficiencies and a focus on higher margin industry sectors.
Operating profit for our UPS Freight unit increased in 2010 compared with the prior year, largely due to better productivity, and increases in base pricing and volume. Productivity metrics increased, including increases in pickup and delivery stops per hour and linehaul utilization.
All of the remaining businesses within this segment had an operating profit during the year. Combined operating profit for these businesses was lower in 2010 than in 2009, primarily due to the gain on sale of substantially all our international Mail Boxes Etc. operations during the second quarter of 2009.
31
2009 compared to 2008
The lower operating profit in the forwarding unit was impacted by the weak global demand for forwarding services, as well as capacity reductions by outside ocean and air freight carriers. During the latter half of 2009 and particularly in the fourth quarter, capacity constraints led to rapidly escalating rates on air freight which could not be passed on to customers, resulting in a negative impact to operating profit and margin. The operating profit for our logistics unit declined slightly, and was impacted by the loss incurred on the sale of some non-core European logistics operations. However, the operating margin in this business remained stable, as costs were reduced commensurate with the decline in revenues.
Our UPS Freight unit reported improved profitability for 2009, due to a reduction in vacation accruals resulting from modifications in vacation policies and changes in the workforce coverage of our individual plans. Excluding this reduction in vacation liabilities, the UPS Freight unit reported a small operating loss due to the economic recession and difficult LTL market in the United States.
The combined operating income for all of our other businesses in this segment increased during the year. The increase was primarily driven by a gain on sale of substantially all of our international Mail Boxes Etc. operations during the second quarter.
Operating Expenses
| Year Ended December 31, | % Change | |||||||||||||||||||
| 2010 | 2009 | 2008 | 2010 / 2009 | 2009 / 2008 | ||||||||||||||||
| Operating Expenses (in millions): |
||||||||||||||||||||
| Compensation and Benefits |
$ | 26,324 | $ | 25,640 | $ | 26,063 | 2.7 | % | (1.6 | )% | ||||||||||
| Impact of Restructuring Charge |
(98 | ) | — | — | ||||||||||||||||
| Adjusted Compensation and Benefits |
26,226 | 25,640 | 26,063 | 2.3 | % | (1.6 | )% | |||||||||||||
| Repairs and Maintenance |
1,131 | 1,075 | 1,194 | 5.2 | % | (10.0 | )% | |||||||||||||
| Depreciation and Amortization |
1,792 | 1,747 | 1,814 | 2.6 | % | (3.7 | )% | |||||||||||||
| Purchased Transportation |
6,640 | 5,379 | 6,550 | 23.4 | % | (17.9 | )% | |||||||||||||
| Fuel |
2,972 | 2,365 | 4,134 | 25.7 | % | (42.8 | )% | |||||||||||||
| Other Occupancy |
939 | 985 | 1,027 | (4.7 | )% | (4.1 | )% | |||||||||||||
| Other Expenses |
3,873 | 4,305 | 5,322 | (10.0 | )% | (19.1 | )% | |||||||||||||
| Impact of Gain on Sale of Real Estate |
109 | — | — | |||||||||||||||||
| Impact of Gain on Sales of Businesses |
20 | — | — | |||||||||||||||||
| Impact of Aircraft Impairment Charge |
— | (181 | ) | — | ||||||||||||||||
| Impact of Goodwill and Intangible Impairment Charges |
— | — | (575 | ) | ||||||||||||||||
| Adjusted Other Expenses |
4,002 | 4,124 | 4,747 | (3.0 | )% | (13.1 | )% | |||||||||||||
| Total Operating Expenses |
$ | 43,671 | $ | 41,496 | $ | 46,104 | 5.2 | % | (10.0 | )% | ||||||||||
| Adjusted Total Operating Expenses |
43,702 | 41,315 | 45,529 | 5.8 | % | (9.3 | )% | |||||||||||||
| Currency Translation (Benefit) Cost |
$ | 11 | $ | (390 | ) | |||||||||||||||
Compensation and Benefits
The increase in compensation and benefits expense during 2010 compared with 2009 was impacted by several items. Payroll costs increased, largely due to higher accruals for management incentive compensation plans resulting from improved company financial results. Union payroll costs also increased due to contractual wage increases. These factors were partially offset by a decline in union labor hours, as well as a reduction in management salary costs resulting from a decrease in the total number of management employees through attrition combined with voluntary and involuntary workforce reductions.
32
Benefits expense increased in 2010, due largely to increases in pension expense, health and welfare expense, and relocation-related benefit costs for management employees. Pension expense increases resulted primarily from higher union contribution rates for multi-employer pension plans. The relocation benefit costs relate to the restructuring of our domestic package operations that occurred in the first quarter of 2010. This increase in health and welfare costs, which was primarily driven by health cost inflation, was somewhat mitigated by reductions in the total number of management employees and union employees covered by UPS-sponsored health and welfare benefit plans.
The decrease in compensation and benefits expense during 2009 compared with 2008 was impacted by several items. A large component of this decrease was related to employee payroll costs, as union labor hours declined as a result of lower U.S. Domestic Package volume, and management payroll declined as a result of a reduction in the total number of management employees through attrition combined with a wage freeze. Benefits expense increased due to higher employee health and welfare program costs, which were impacted by higher union contribution rates, and increased pension expense. Pension expense increases resulted from higher union contribution rates for multi-employer pension plans, combined with increased interest costs, a decrease in our expected return on plan assets and the amortization of actuarial losses for company-sponsored plans. The interest cost grew due to continued service accruals, while the decrease in expected return on plan assets and the actuarial losses were primarily due to the negative asset returns experienced in 2008. The overall increase in benefits expense was partially offset by a freeze in the company contributions to our primary employee defined contribution savings plan.
Repairs and Maintenance
Repairs and maintenance expense increased in 2010, largely due to higher costs for maintenance on our vehicle fleet. Repairs and maintenance expense declined in 2009, largely due to reduced vehicle maintenance expenses resulting from a reduction in miles driven.
Depreciation and Amortization
Depreciation and amortization expense increased in 2010, primarily as a result of depreciation expense on equipment and facilities capitalized in conjunction with the recent Worldport expansion. Amortization of intangible assets also increased as a result of new intangibles recognized related to the Unsped acquisition in Turkey in the third quarter of 2009, as well as corporate sponsorships entered into in 2010.
Depreciation and amortization expense decreased in 2009, primarily as a result of lower depreciation expense on equipment and facilities, as certain Worldport assets became fully depreciated, as well as lower software amortization resulting from fewer new capitalized software projects. These decreases were partially offset by higher depreciation expense on aircraft and vehicles, resulting from new deliveries in 2008 and 2009.
Purchased Transportation
The increase in purchased transportation in 2010 was driven by higher freight forwarding volume and rates in Asia and Europe, as well as increased fuel surcharge rates charged to us by third-party carriers as a result of higher fuel prices. The decrease in purchased transportation in 2009 was driven by a combination of lower volume in our international package and forwarding businesses, a stronger U.S. Dollar, and decreased fuel surcharge rates charged to us by third-party carriers as a result of lower fuel prices.
Fuel
The increase in fuel expense in 2010 was caused primarily by higher prices for jet-A fuel, diesel, and unleaded gasoline, as well as a slight increase in usage of these products in our operations. The decrease in fuel expense in 2009 was impacted by significantly lower prices for jet-A fuel, diesel, and unleaded gasoline, as well as lower usage of these products in our operations.
33
Other Occupancy
The decrease in other occupancy expense in 2010 was primarily due to decreased labor and overhead expenses, and lower rent expense on leased facilities. The decrease in other occupancy expense in 2009 was primarily caused by lower electricity and natural gas costs, as well as lower rent expense.
Other Expenses
The decrease in other expenses in 2010 was largely due to reductions in bad debt expense and foreign currency transaction expense, which reflected gains during 2010 compared to losses in 2009. Additionally, we incurred a loss on the sale of a French repair business in 2009. Additional expense reductions in 2010 were due to cost containment programs, including reductions in telecom costs, office supplies, and outside professional fees. We also incurred lower expenses associated with auto liability insurance and customer claims for lost or damaged packages.
The decline in other expenses in 2009, exclusive of impairment charges, was due in part to certain variable costs that declined as a result of lower package volume, such as the expense associated with customer claims for lost or damaged packages, rent expense for transportation equipment, cargo handling costs, and aircraft landing fees. Additionally, certain other costs declined primarily as a result of cost containment programs, such as employee expense reimbursements, office supplies, professional services, and advertising costs.
Investment Income and Interest Expense
| Year Ended December 31, | % Change | |||||||||||||||||||
| 2010 | 2009 | 2008 | 2010 / 2009 | 2009 / 2008 | ||||||||||||||||
| Investment Income and Interest Expense (in millions): |
||||||||||||||||||||
| Investment Income |
$ | 3 | $ | 10 | $ | 75 | (70.0 | )% | (86.7 | )% | ||||||||||
| Interest Expense |
$ | (354 | ) | $ | (445 | ) | $ | (442 | ) | (20.4 | )% | 0.7 | % | |||||||
| Impact of Currency Remeasurement Charge |
— | 77 | — | |||||||||||||||||
| Adjusted Interest Expense |
$ | (354 | ) | $ | (368 | ) | $ | (442 | ) | (3.8 | )% | (16.7 | )% | |||||||
Investment Income
The decrease in investment income in 2010 was primarily due to a lower yield earned on our invested assets as a result of declines in short-term interest rates in the United States, as well as higher impairment losses on our holdings of auction rate and preferred securities. The 2009 decline was largely due to a lower average balance of interest-earning investments, a significantly lower yield earned on our invested assets as a result of declines in short-term interest rates in the United States, and a loss on the fair value adjustments of certain investment partnerships.
During the second quarter of 2010, we recorded impairment losses on certain asset-backed auction rate securities. The impairment charge resulted from provisions that allow the issuers of the securities to subordinate our holdings to newly issued debt or to tender for the securities at less than their par value. These securities, which had a cost basis of $128 million, were written down to their fair value of $107 million as of June 30, 2010, resulting in an other-than-temporary impairment of $21 million.
During the second quarter of 2009, we recorded impairment losses on certain perpetual preferred securities, and an auction rate security collateralized by preferred securities, issued by large financial institutions. The
34
impairment charge resulted from conversion offers from the issuers of these securities at prices well below the stated redemption value of the preferred shares. These securities, which had a cost basis of $42 million, were written down to their fair value of $25 million as of June 30, 2009, resulting in an other-than-temporary impairment of $17 million.
Interest Expense
The decrease in interest expense in 2010 was primarily due to lower average debt balances, but this was partially offset by lower capitalized interest, due to the recent completion of several large construction projects, including our Worldport expansion. Excluding the currency remeasurement charge, the 2009 decrease in interest expense was largely due to lower average debt balances and lower average interest rates incurred on variable rate debt and interest rate swaps.
Income Tax Expense
| Year Ended December 31, | % Change | |||||||||||||||||||
| 2010 | 2009 | 2008 | 2010 / 2009 | 2009 / 2008 | ||||||||||||||||
| Income Tax Expense |
$ | 2,035 | $ | 1,214 | $ | 2,012 | 67.6 | % | (39.7 | )% | ||||||||||
| Impact of Charge for Change in Tax Filing Status for German Subsidiary |
(76 | ) | — | — | ||||||||||||||||
| Impact of Restructuring Charge |
34 | — | — | |||||||||||||||||
| Impact of Gain on Sales of Businesses |
(23 | ) | — | — | ||||||||||||||||
| Impact of Gain on Sale of Real Estate |
(48 | ) | — | — | ||||||||||||||||
| Impact of Aircraft Impairment Charge |
— | 65 | — | |||||||||||||||||
| Impact of Currency Remeasurement Charge |
— | 29 | — | |||||||||||||||||
| Adjusted Income Tax Expense |
$ | 1,922 | $ | 1,308 | $ | 2,012 | 46.9 | % | (35.0 | )% | ||||||||||
| Effective Tax Rate |
36.8 | % | 36.1 | % | 40.1 | % | ||||||||||||||
| Adjusted Effective Tax Rate |
35.0 | % | 36.1 | % | 36.0 | % | ||||||||||||||
2010 compared to 2009
The increase in our effective tax rate in 2010 compared with 2009 was attributable to the higher marginal tax rate applied to the gain on the sale of real estate, as well as the change in the tax filing status of a German subsidiary that occurred in the first quarter of 2010. Additionally, we are currently unable to recognize the entire potential tax benefit of tax loss carryforwards generated from the sale of a Supply Chain & Freight business in Germany in the first quarter of 2010.
Excluding these items, our adjusted year-to-date effective tax rate decreased in 2010 compared to 2009 primarily due to the effect of having a higher proportion of our taxable income in 2010 being subject to tax outside the United States, where statutory tax rates are generally lower.
2009 compared to 2008
Income tax expense declined primarily due to lower pre-tax income. The decrease in our effective tax rate was primarily due to the goodwill and intangible impairment charges described previously, which were not deductible for tax purposes and resulted in the effective tax rate increasing by 4.1%. This was partially offset by an increase in our first quarter 2009 income tax provision as a result of providing a valuation allowance of $14 million against certain deferred tax assets in our International Package business.
35
Liquidity and Capital Resources
Operating Activities
Cash from operating activities remained strong throughout the 2008 to 2010 time period. In 2010, operating cash flow was reduced by $2.0 billion in discretionary contributions to our UPS Retirement and UPS Pension Plans, as well as an increase in working capital needs due to underlying growth in our business. In 2009, operating cash flow was adversely impacted by the decline in profitability for our three reporting segments. In 2008, operating cash flow increased by approximately $1.228 billion due to tax refunds received that year related to our previous withdrawal from the Central States Pension Plan. The following table provides a summary of the major items affecting our operating cash flows (in millions):
| 2010 | 2009 | 2008 | ||||||||||
| Net income |
$ | 3,488 | $ | 2,152 | $ | 3,003 | ||||||
| Non-cash operating activities(a) |
4,248 | 3,863 | 4,539 | |||||||||
| Pension and postretirement plan contributions (UPS-sponsored plans) |
(3,240 | ) | (924 | ) | (246 | ) | ||||||
| Income tax receivables and payables |
(319 | ) | 245 | 1,167 | ||||||||
| Changes in working capital and other noncurrent assets and liabilities |
(340 | ) | (137 | ) | (6 | ) | ||||||
| Other operating activities |
(2 | ) | 86 | (31 | ) | |||||||
| Net cash from operating activities |
$ | 3,835 | $ | 5,285 | $ | 8,426 | ||||||
| (a) | Represents depreciation and amortization, gains and losses on derivative transactions and foreign exchange, deferred income taxes, provisions for uncollectible accounts, pension and postretirement benefit expense, stock compensation expense, impairment charges, and other non-cash items. |
Except for the $2.0 billion discretionary contributions to our UPS Retirement and UPS Pension plans in 2010, contributions to our company-sponsored pension plans have largely varied based on whether any minimum funding requirements are present for individual pension plans. The remaining increases in contributions in 2010 and 2009 were largely due to minimum funding requirements related to the UPS IBT Pension Plan. As discussed further in the “Contractual Commitments” section, we have minimum funding requirements in the next several years, primarily related to the UPS IBT Pension Plan. In January 2011, we made a $1.2 billion contribution to the UPS IBT Pension Plan, which represented an acceleration of contributions that would have been required in 2011 and over $350 million in contributions that would not have been required until after 2011.
Investing Activities
Our primary uses of cash flows for investing activities were for capital expenditures, as follows (amounts in millions):
| 2010 | 2009 | 2008 | ||||||||||
| Net cash used in investing activities |
$ | 654 | $ | 1,248 | $ | 3,179 | ||||||
| Capital Expenditures: |
||||||||||||
| Buildings and facilities |
$ | 352 | $ | 568 | $ | 968 | ||||||
| Aircraft and parts |
416 | 611 | 852 | |||||||||
| Vehicles |
339 | 209 | 539 | |||||||||
| Information technology |
282 | 214 | 277 | |||||||||
| $ | 1,389 | $ | 1,602 | $ | 2,636 | |||||||
| Capital Expenditures as a % of Revenue |
2.8 | % | 3.5 | % | 5.1 | % | ||||||
| Other Investing Activities: |
||||||||||||
| Proceeds from disposals of property, plant and equipment |
$ | 304 | $ | 60 | $ | 147 | ||||||
| Net (increase) decrease in finance receivables |
$ | 108 | $ | 261 | $ | (49 | ) | |||||
| Net (purchases) sales of marketable securities |
$ | 30 | $ | (11 | ) | $ | (278 | ) | ||||
| Other investing activities |
$ | 293 | $ | 44 | $ | (363 | ) | |||||
36
We have commitments for the purchase of aircraft, vehicles, equipment and real estate to provide for the replacement of existing capacity and anticipated future growth. We generally fund our capital expenditures with our cash from operations. In 2010, we reduced capital spending to a level commensurate with our current anticipated operating needs. Future capital spending for anticipated growth and replacement assets will depend on a variety of factors, including economic and industry conditions.
The decline in capital expenditures on buildings and facilities primarily resulted from the completion of several large hub construction and expansion projects, including our Worldport hub expansion, as well as the expansion and new construction projects at other facilities in Europe, Canada and China. In 2009, we completed the first phase of our Worldport expansion, which increased the sorting capacity by 15%. The final phase of the Worldport expansion was completed in 2010, with an additional sorting capacity of approximately 20%. In 2008, we opened our new international air hub in Shanghai, China, and also began construction of our new intra-Asia air hub in Shenzhen, China, which became operational in February 2010.
Capital spending on aircraft over the 2008 to 2010 period was largely due to scheduled deliveries of previous orders for the Boeing 767-300 and 747-400, and MD-11 aircraft. Capital spending on vehicles was primarily for replacement assets in our package delivery and LTL operations. We anticipate that our capital expenditures for 2011 will be approximately $2.2 billion, or approximately 4% of revenue. Future capital spending for anticipated growth and replacement assets will depend on a variety of factors, including economic and industry conditions.
The increase in proceeds from the disposal of property, plant and equipment is largely due to real estate sales and the proceeds from insurance recoveries in 2010. The net change in finance receivables is primarily due to customer paydowns and new loan origination activity, primarily in our commercial lending, asset-based lending and leasing portfolios. The purchases and sales of marketable securities are largely determined by liquidity needs, and will therefore fluctuate from period to period.
Other investing activities include the cash settlement of derivative contracts used in our energy and currency hedging programs, the timing of aircraft purchase contract deposits on our Boeing 767-300 and Boeing 747-400 aircraft orders, and changes in restricted cash balances. We maintain an escrow agreement with an insurance carrier to guarantee our self-insurance obligations, and we deposited $95 and $191 million in cash collateral with the insurance carrier under this agreement during 2009 and 2008, respectively. We received (paid) cash related to purchases and settlements of energy and currency derivative contracts used in our hedging programs of $111, $117, and $(208) million during 2010, 2009, and 2008, respectively.
37
Financing Activities
Our primary uses of cash flows for financing activities are to repurchase shares, pay cash dividends, and repay debt principal, as follows (amounts in millions, except per share data):
| 2010 | 2009 | 2008 | ||||||||||
| Net cash used in financing activities |
$ | (1,346 | ) | $ | (3,045 | ) | $ | (6,702 | ) | |||
| Share Repurchases: |
||||||||||||
| Cash expended for shares repurchased |
$ | (817 | ) | $ | (561 | ) | $ | (3,570 | ) | |||
| Number of shares repurchased |
(12.4 | ) | (10.9 | ) | (53.6 | ) | ||||||
| Shares outstanding at year-end |
991 | 994 | 996 | |||||||||
| Percent reduction in shares outstanding |
(0.3 | )% | (0.2 | )% | (4.3 | )% | ||||||
| Dividends: |
||||||||||||
| Dividends declared per share |
$ | 1.88 | $ | 1.80 | $ | 1.80 | ||||||
| Cash expended for dividend payments |
$ | (1,818 | ) | $ | (1,751 | ) | $ | (2,219 | ) | |||
| Borrowings: |
||||||||||||
| Net borrowings (repayments) of debt principal |
$ | 1,246 | $ | (522 | ) | $ | (921 | ) | ||||
| Other Financing Activities: |
||||||||||||
| Cash received for common stock issuances |
$ | 218 | $ | 149 | $ | 169 | ||||||
| Other financing activities |
$ | (175 | ) | $ | (360 | ) | $ | (161 | ) | |||
| Capitalization: |
||||||||||||
| Total debt outstanding at year-end |
$ | 10,846 | $ | 9,521 | $ | 9,871 | ||||||
| Total shareowners’ equity at year-end |
8,047 | 7,696 | 6,780 | |||||||||
| Total capitalization |
$ | 18,893 | $ | 17,217 | $ | 16,651 | ||||||
| Debt to Total Capitalization % |
57.4 | % | 55.3 | % | 59.3 | % | ||||||
In January 2008, the Board of Directors approved an increase in our share repurchase authorization to $10.0 billion. Share repurchases may take the form of accelerated share repurchases, open market purchases, or other such methods as we deem appropriate. The timing of our share repurchases will depend upon market conditions. As a result of the uncertain economic environment in 2010 and 2009, we slowed our share repurchase activity, and repurchased shares at a rate that approximately offset the dilution from our stock compensation programs. Unless terminated earlier by the resolution of our Board, the program will expire when we have purchased all shares authorized for repurchase under the program. As of December 31, 2010, we had $5.194 billion of our share repurchase authorization remaining. In 2011, we anticipate increasing our share repurchase activity to approximately $2.0 billion.
The declaration of dividends is subject to the discretion of the Board of Directors and will depend on various factors, including our net income, financial condition, cash requirements, future prospects, and other relevant factors. We expect to continue the practice of paying regular cash dividends. In 2008, the Board of Directors approved an earlier payment schedule for the November dividend declaration, as in past years this dividend was payable the following January. As a result, a total of five dividend payments were made in 2008. In February 2011, we increased our quarterly dividend payment from $0.47 to $0.52 per share, an 11% increase.
In 2010, 2009, and 2008, we completed senior fixed rate note offerings of $2.0, $2.0, and $4.0 billion, respectively. These note offerings were used for various purposes, including discretionary contributions to UPS-sponsored pension plans, the retirement of existing debt instruments, and the refinancing of commercial paper that was used to fund our withdrawal from the Central States Pension Plan.
38
Other than commercial paper, repayments of debt consisted primarily of scheduled principal payments on our capital lease obligations, redemption of facilities bonds and the UPS Notes program, and principal payments on debt related to our investment in certain partnerships. We consider the overall fixed and floating interest rate mix of our portfolio and the related overall cost of borrowing when planning for future issuances and non-scheduled repayments of debt.
Cash received from common stock issuances to employees increased primarily due to additional stock option exercises in 2010. The cash outflows in other financing activities is largely due to repurchases of shares from employees to satisfy tax withholding obligations, as well as certain hedging activities on forecasted debt issuances. In conjunction with the senior fixed rate debt offerings in 2010, 2009 and 2008, we settled several interest rate derivatives that were designated as hedges of these debt offerings, which resulted in cash inflows (outflows) of $11, ($243) and ($84) million, respectively.
Sources of Credit
We are authorized to borrow up to $10.0 billion under our U.S. commercial paper program. As of December 31, 2010, we had $341 million of commercial paper outstanding, with an average interest rate of 0.18% and a weighted average maturity of 14 days. The amount of commercial paper outstanding in 2011 is expected to fluctuate. We also maintain a European commercial paper program under which we are authorized to borrow up to €1.0 billion in a variety of currencies, however no amounts were outstanding under this program as of December 31, 2010.
We maintain two credit agreements with a consortium of banks. One of these agreements provides revolving credit facilities of $1.5 billion, and expires on April 14, 2011. Interest on any amounts we borrow under this facility would be charged at 90-day LIBOR plus a percentage determined by quotations from Markit Group Ltd. for our 1-year credit default swap spread, subject to certain minimum rates and maximum rates based on our public debt ratings from Standard & Poor’s and Moody’s. If our public debt ratings are A / A2 or above, the minimum applicable margin is 0.50% and the maximum applicable margin is 1.50%; if our public debt ratings are lower than A / A2, the minimum applicable margin is 1.00% and the maximum applicable margin is 2.50%.
The second agreement provides revolving credit facilities of $1.0 billion, and expires on April 19, 2012. Interest on any amounts we borrow under this facility would be charged at 90-day LIBOR plus 15 basis points. At December 31, 2010, there were no outstanding borrowings under either of these facilities.
Our existing debt instruments and credit facilities do not have cross-default or ratings triggers, however these debt instruments and credit facilities do subject us to certain financial covenants. As of December 31, 2010 and for all prior periods presented, we have satisfied these financial covenants. These covenants limit the amount of secured indebtedness that we may incur, and limit the amount of attributable debt in sale-leaseback transactions, to 10% of net tangible assets. As of December 31, 2010, 10% of net tangible assets is equivalent to $2.501 billion, however we have no covered sale-leaseback transactions or secured indebtedness outstanding. Additionally, we are required to maintain a minimum net worth, as defined, of $5.0 billion on a quarterly basis. As of December 31, 2010, our net worth, as defined, was equivalent to $14.174 billion. We do not expect these covenants to have a material impact on our financial condition or liquidity.
Guarantees and Other Off-Balance Sheet Arrangements
We do not have guarantees or other off-balance sheet financing arrangements, including variable interest entities, which we believe could have a material impact on financial condition or liquidity.
39
Contractual Commitments
We have contractual obligations and commitments in the form of capital leases, operating leases, debt obligations, purchase commitments, and certain other liabilities. We intend to satisfy these obligations through the use of cash flow from operations. The following table summarizes the expected cash outflow to satisfy our contractual obligations and commitments as of December 31, 2010 (in millions):
| Commitment Type |
2011 | 2012 | 2013 | 2014 | 2015 | After 2016 | Total | |||||||||||||||||||||
| Capital Leases |
$ | 18 | $ | 19 | $ | 19 | $ | 20 | $ | 21 | $ | 112 | $ | 209 | ||||||||||||||
| Operating Leases |
348 | 268 | 205 | 150 | 113 | 431 | 1,515 | |||||||||||||||||||||
| Debt Principal |
345 | — | 1,750 | 1,000 | 100 | 7,363 | 10,558 | |||||||||||||||||||||
| Debt Interest |
322 | 321 | 300 | 274 | 269 | 4,940 | 6,426 | |||||||||||||||||||||
| Purchase Commitments |
642 | 463 | 425 | 16 | — | — | 1,546 | |||||||||||||||||||||
| Pension Fundings |
1,200 | 196 | 752 | 541 | 274 | — | 2,963 | |||||||||||||||||||||
| Other Liabilities |
69 | 67 | 64 | 58 | 43 | 38 | 339 | |||||||||||||||||||||
| Total |
$ | 2,944 | $ | 1,334 | $ | 3,515 | $ | 2,059 | $ | 820 | $ | 12,884 | $ | 23,556 | ||||||||||||||
Our capital lease obligations relate primarily to leases on aircraft. Capital leases, operating leases, and purchase commitments, as well as our debt principal obligations, are discussed further in Note 7 to our consolidated financial statements. The amount of interest on our debt was calculated as the contractual interest payments due on our fixed-rate debt, in addition to interest on variable rate debt that was calculated based on interest rates as of December 31, 2010. The calculations of debt interest take into account the effect of interest rate swap agreements. For debt denominated in a foreign currency, the U.S. Dollar equivalent principal amount of the debt at the end of the year was used as the basis to calculate future interest payments.
Purchase commitments represent contractual agreements to purchase goods or services that are legally binding, the largest of which are orders for aircraft, engines, and parts. As of December 31, 2010, we have firm commitments to purchase 20 Boeing 767-300ER freighters to be delivered between 2011 and 2013, and two Boeing 747-400F aircraft scheduled for delivery during 2011. These aircraft purchase orders will provide for the replacement of existing capacity and anticipated future growth.
Pension fundings represent the anticipated required cash contributions that will be made to our qualified pension plans. These contributions include those to the UPS IBT Pension Plan, which was established upon ratification of the national master agreement with the Teamsters, as well as the UPS Pension Plan. These plans are discussed further in Note 5 to the consolidated financial statements. The pension funding requirements were estimated under the provisions of the Pension Protection Act of 2006 and the Employee Retirement Income Security Act of 1974, using discount rates, asset returns, and other assumptions appropriate for these plans. To the extent that the funded status of these plans in future years differs from our current projections, the actual contributions made in future years could materially differ from the amounts shown in the table above. Additionally, we have not included minimum funding requirements beyond 2015, because these projected contributions are not reasonably determinable.
We are not subject to any minimum funding requirement for cash contributions in 2011 in the UPS Retirement Plan or UPS Pension Plan. The amount of any minimum funding requirement, as applicable, for these plans could change significantly in future periods, depending on many factors, including future plan asset returns and discount rates. A sustained significant decline in the world equity markets, and the resulting impact on our pension assets and investment returns, could result in our domestic pension plans being subject to significantly higher minimum funding requirements. Such an outcome could have a material adverse impact on our financial position and cash flows in future periods.
The contractual payments due for “other liabilities” primarily include commitment payments related to our investment in certain partnerships. The table above does not include approximately $284 million of liabilities for
40
uncertain tax positions because we are uncertain if or when such amounts will ultimately be settled in cash. In addition, we also have recognized assets associated with uncertain tax positions in excess of the related liabilities such that we do not believe a net contractual obligation exists to the taxing authorities. Uncertain tax positions are further discussed in Note 12 to the consolidated financial statements.
As of December 31, 2010, we had outstanding letters of credit totaling approximately $1.580 billion issued in connection with routine business requirements. We also issue surety bonds as an alternative to letters of credit in certain instances, and as of December 31, 2010, we had $577 million of surety bonds written. As of December 31, 2010, we had unfunded loan commitments totaling $602 million associated with our financial business.
We believe that funds from operations and borrowing programs will provide adequate sources of liquidity and capital resources to meet our expected long-term needs for the operation of our business, including anticipated capital expenditures, such as commitments for aircraft purchases, for the foreseeable future.
Contingencies
We are a defendant in a number of lawsuits filed in state and federal courts containing various class action allegations under state wage-and-hour laws. In one of these cases, Marlo v. UPS, which was certified as a class action in a California federal court in September 2004, plaintiffs allege that they improperly were denied overtime, and seek penalties for missed meal and rest periods, and interest and attorneys’ fees. Plaintiffs purport to represent a class of 1,300 full-time supervisors. In August 2005, the court granted summary judgment in favor of UPS on all claims, and plaintiffs appealed the ruling. In October 2007, the appeals court reversed the lower court’s ruling. In April 2008, the Court decertified the class and vacated the trial scheduled for that month. After decertification, some plaintiffs filed individual lawsuits raising the same allegations as in the underlying class action. These individual lawsuits are in various stages. We have denied any liability with respect to these claims and intend to vigorously defend ourselves in these cases. At this time, we have not determined the amount of any liability that may result from these matters or whether such liability, if any, would have a material adverse effect on our financial condition, results of operations or liquidity.
UPS and our subsidiary Mail Boxes Etc., Inc. are defendants in various lawsuits brought by franchisees who operate Mail Boxes Etc. centers and The UPS Store locations. These lawsuits relate to the rebranding of Mail Boxes Etc. centers to The UPS Store, The UPS Store business model, the representations made in connection with the rebranding and the sale of The UPS Store franchises, and UPS’s sale of services in the franchisees’ territories. In one of the actions, which is pending in California state court, the court certified a class consisting of all Mail Boxes Etc. branded stores that rebranded to The UPS Store in March 2003. We have denied any liability with respect to these claims and intend to defend ourselves vigorously. At this time, we have not determined the amount of any liability that may result from these matters or whether such liability, if any, would have a material adverse effect on our financial condition, results of operations or liquidity.
In Barber Auto Sales v. UPS, which a federal court in Alabama certified as a class action in September 2009, the plaintiff asserts a breach of contract claim arising from UPS’s assessment of shipping charge corrections when UPS determines that the “dimensional weight” of packages is greater than reported by the shipper. We have denied any liability with respect to these claims and intend to vigorously defend ourselves in this case. At this time, we have not determined the amount of any liability that may result from this matter or whether such liability, if any, would have a material adverse effect on our financial condition, results of operations or liquidity.
In AFMS LLC v. UPS and FedEx Corporation, a lawsuit filed in federal court in the Central District of California in August 2010, the plaintiff asserts that UPS and FedEx violated U.S. antitrust law by conspiring to refuse to negotiate with third party negotiators retained by shippers and/or to monopolize a so-called market for
41
the time sensitive delivery of letters and packages. The Antitrust Division of the U.S. Department of Justice (“DOJ”) has informed us that it has opened a civil investigation of our policies and practices for dealing with third party negotiators. We are cooperating with this investigation. We deny any liability with respect to these matters and intend to vigorously defend ourselves. At this time, we have not determined the amount of any liability that may result from these matters or whether such liability, if any, would have a material adverse effect on our financial condition, results of operations or liquidity.
We are a defendant in various other lawsuits that arose in the normal course of business. We believe that the eventual resolution of these cases will not have a material adverse effect on our financial condition, results of operations or liquidity.
We file income tax returns in the U.S. federal jurisdiction, most U.S. state and local jurisdictions, and many non-U.S. jurisdictions. We have substantially resolved all U.S. federal income tax matters for tax years prior to 2003. During the fourth quarter of 2010, we received a refund of $139 million as a result of the resolution of tax years 2003 through 2004 with the Internal Revenue Service (“IRS”) Appeals Office. Along with the audit for tax years 2005 through 2007, the IRS is currently examining non-income based taxes, including employment and excise taxes, which could lead to proposed assessments. The IRS has not presented an official position with regard to these taxes at this time, and therefore we are not able to determine the technical merit of any potential assessment. We anticipate receipt of the IRS reports on these matters by the end of the second quarter of 2011. We have filed all required U.S. state and local returns reporting the result of the resolution of the U.S. federal income tax audit of the tax years 2003 and 2004. A limited number of U.S. state and local matters are the subject of ongoing audits, administrative appeals or litigation.
As of December 31, 2010, we had approximately 250,000 employees employed under a national master agreement and various supplemental agreements with local unions affiliated with the International Brotherhood of Teamsters (“Teamsters”). These agreements run through July 31, 2013. We have approximately 2,800 pilots who are employed under a collective bargaining agreement with the Independent Pilots Association (“IPA”), which becomes amendable at the end of 2011. Our airline mechanics are covered by a collective bargaining agreement with Teamsters Local 2727, which became amendable in November 2006. We began formal negotiations with Teamsters Local 2727 in October 2006, and have been under the guidance of the National Mediation Board since January 2008. In January 2011, we reached a tentative agreement with Teamsters Local 2727 which will run through November 1, 2013 when ratified. In addition, the majority (approximately 3,300) of our ground mechanics who are not employed under agreements with the Teamsters are employed under collective bargaining agreements with the International Association of Machinists and Aerospace Workers (“IAM”). Our agreement with the IAM runs through July 31, 2014.
We participate in a number of trustee-managed multi-employer pension and health and welfare plans for employees covered under collective bargaining agreements. Several factors could cause us to make significantly higher future contributions to these plans, including unfavorable investment performance, changes in demographics, and increased benefits to participants. At this time, we are unable to determine the amount of additional future contributions, if any, or whether any material adverse effect on our financial condition, results of operations, or liquidity would result from our participation in these plans.
In January 2008, a class action complaint was filed in the United States District Court for the Eastern District of New York alleging price-fixing activities relating to the provision of freight forwarding services. UPS was not named in this case. On July 21, 2009, the plaintiffs filed a first amended complaint naming numerous global freight forwarders as defendants. UPS and UPS Supply Chain Solutions are among the 60 defendants named in the amended complaint. We intend to vigorously defend ourselves in this case. At this time, we have not determined the amount of any liability that may result from these matters or whether such liability, if any, would have a material adverse effect on our financial condition, results of operations or liquidity.
42
Other Matters
We received a grand jury subpoena from the Antitrust Division of the DOJ regarding the DOJ’s investigation into certain pricing practices in the freight forwarding industry in December 2007.
In October 2007, June 2008, and February 2009, we received information requests from the European Commission (“Commission”) relating to its investigation of certain pricing practices in the freight forwarding industry, and subsequently responded to each request. On February 9, 2010, UPS received a Statement of Objections by the Commission. This document contains the Commission’s preliminary view with respect to alleged anticompetitive behavior in the freight forwarding industry by 18 freight forwarders, including UPS. Although it alleges anticompetitive behavior, it does not prejudge the Commission’s final decision, as to facts or law (which is subject to appeal to the European courts). The options available to the Commission include taking no action or imposing a monetary fine; the range of any potential action by the Commission is not reasonably estimable. Any decision imposing a fine would be subject to appeal. UPS has responded to the Statement of Objections, including at a July 2010 Commission hearing, and we intend to continue to vigorously defend ourselves in this proceeding. We received an additional information request from the Commission in January 2011, and will respond in due course.
In August 2010, competition authorities in Brazil opened an administrative proceeding to investigate alleged anticompetitive behavior in the freight forwarding industry. Approximately 45 freight forwarding companies and individuals are named in the proceeding, including UPS, UPS SCS Transportes (Brasil) S.A., and a former employee in Brazil. UPS will have an opportunity to respond to these allegations.
We also received and responded to related information requests from competition authorities in other jurisdictions.
We are cooperating with each of these investigations, and intend to continue to vigorously defend ourselves. At this time, we are unable to determine the amount of any liability that may result from these matters or whether any such liability would have a material adverse effect on our financial condition, results of operations or liquidity.
Health Care Legislation
The enactment of the “Patient Protection and Affordable Care Act” and “The Health Care and Education Reconciliation Act of 2010” in 2010 will bring significant changes to the U.S. health care system. The legislation eliminated the tax deductibility of Medicare Part D subsidies for retiree prescription drug coverage; however, this impact was not material to our financial results. We are evaluating the long-term impacts of this legislation on us. It is difficult to estimate the impact due to the nature of our workforce, the various years in which certain provisions become applicable, and the fact that additional regulatory and rulemaking actions will be occurring. Our current estimate is that we will incur an additional $50 to $65 million of annual expense beginning in 2011 associated with active employee healthcare coverage, which is primarily due to the multiple coverage provisions of the legislation which require the expansion of dependent coverage to age 26, among other requirements. The December 31, 2010 accumulated postretirement benefit obligation for the postretirement medical plans increased by $37 million due to the excise tax associated with the legislation.
Rate Adjustments
In October 2010, we announced that an increase in base rates and changes in our fuel surcharge for package shipments that took effect January 3, 2011. UPS Ground service rates increased a net 4.9% through a combination of a 5.9% increase in rates and a 1% reduction in the index used to determine the ground fuel surcharge. UPS Next Day Air, UPS 2nd Day Air, UPS 3 Day Select, and international air shipments originating in the United States (including Worldwide Express, Worldwide Express Plus, UPS Worldwide Expedited and UPS International Standard Service) increased a net 4.9%, through a combination of a 6.9% increase in base rates and a 2% reduction in the index used to determine the air fuel surcharge. These rate changes are customary and occur on an annual basis. Rate changes for shipments originating outside the U.S. are made throughout the year and vary by geographic market.
43
Also in October 2010, we announced a 5.9% general rate increase for our UPS Freight LTL unit, which took effect October 18, 2010. The increase covers non-contractual shipments in the U.S., Canada and Mexico, and applies to minimum charge, LTL rates and accessorial charges.
New Accounting Pronouncements
Recently Adopted Accounting Standards
Provisions within the following accounting standards were adopted during the years covered by these financial statements:
Financial Instruments: The Financial Accounting Standards Board (“FASB”) issued guidance in February 2007 that gives entities the option to measure eligible financial assets, financial liabilities and firm commitments at fair value (i.e., the fair value option), on an instrument-by-instrument basis, that are otherwise not accounted for at fair value under other accounting standards. The election to use the fair value option is available at specified election dates, such as when an entity first recognizes a financial asset or financial liability or upon entering into a firm commitment. Subsequent changes in fair value must be recorded in earnings. Additionally, this guidance allowed for a one-time election for existing positions upon adoption, with the transition adjustment recorded to beginning retained earnings. We adopted this standard on January 1, 2008, and elected to apply the fair value option to our investment in certain investment partnerships that were previously accounted for under the equity method. Accordingly, we recorded a $16 million reduction to retained earnings as of January 1, 2008. These investments are reported in “other non-current assets” on the consolidated balance sheets.
Compensation-Retirement Benefits: We previously utilized the early measurement date option available in accounting for our pension and postretirement medical benefit plans, and we measured the funded status of our plans as of September 30 each year. Under guidance issued by the FASB, we were required to use a December 31 measurement date for all of our pension and postretirement benefit plans beginning in 2008. As a result of this change in measurement date, we recorded a cumulative effect after-tax $44 million reduction to retained earnings as of January 1, 2008.
Beginning in 2009, new guidance was adopted that required disclosures about plan assets of a defined benefit pension or other postretirement plan, investment policies and strategies, major categories of plan assets, inputs and valuation techniques used to measure the fair value of plan assets and significant concentrations of risk within plan assets. These disclosures are provided in Note 5 to the consolidated financial statements.
Fair Value Measurements and Disclosures: The FASB issued guidance on fair value measurements that took effect on January 1, 2008 and are presented in Notes 2, 3, 4, 5, and 14 to the consolidated financial statements. On January 1, 2009, we implemented the previously deferred provisions of this guidance for nonfinancial assets and liabilities recorded at fair value. The accounting requirements for determining fair value when the volume and level of activity for an asset or liability have significantly decreased, and for identifying transactions that are not orderly, contained the FASB’s guidance were adopted on April 1, 2009, but had an immaterial impact on our financial statements.
Derivatives and Hedging: The FASB issued certain disclosure requirements for derivatives and hedging transactions that took effect on January 1, 2009 and are presented in Note 14.
44
Business Combinations: The FASB issued new accounting requirements for business combinations, which took effect on January 1, 2009. This new guidance was applied to business combinations completed in 2009, but had an immaterial impact on our financial statements.
Consolidation: The FASB issued accounting and presentation requirements for noncontrolling interests, which took effect on January 1, 2009, however this new guidance had an immaterial impact on our financial statements.
Accounting Standards Issued But Not Yet Effective
Accounting guidance issued, but not effective until after December 31, 2010, are not expected to have a significant effect on our consolidated financial position or results of operations.
Critical Accounting Policies and Estimates
Our discussion and analysis of our financial condition and results of operations are based on our consolidated financial statements, which are prepared in accordance with accounting principles generally accepted in the United States of America. As indicated in Note 1 to our consolidated financial statements, the amounts of assets, liabilities, revenue, and expenses reported in our financial statements are affected by estimates and judgments that are necessary to comply with generally accepted accounting principles. We base our estimates on prior experience and other assumptions that we consider reasonable to our circumstances. Actual results could differ from our estimates, which would affect the related amounts reported in our financial statements. While estimates and judgments are applied in arriving at many reported amounts, we believe that the following matters may involve a higher degree of judgment and complexity.
Contingencies
As discussed in Note 8 to our consolidated financial statements, we are involved in various legal proceedings and contingencies. We record a liability based on our estimate of the probable cost of the resolution of a contingency. The actual resolution of these contingencies may differ from our estimates. If a contingency is settled for an amount greater than our estimate, a future charge to income would result. Likewise, if a contingency is settled for an amount that is less than our estimate, a future credit to income would result.
The events that may impact our contingent liabilities are often unique and generally are not predictable. At the time a contingency is identified, we consider all relevant facts as part of our evaluation. We record a liability for a loss when the loss is probable of occurring and reasonably estimable. Events may arise that were not anticipated and the outcome of a contingency may result in a loss to us that differs from our previously estimated liability. These factors could result in a material difference between estimated and actual operating results. Contingent losses that are probable and estimable, excluding those related to income taxes and self insurance which are discussed further below, were not material to the Company’s financial position as of December 31, 2010. In addition, we have certain contingent liabilities that have not been recognized as of December 31, 2010, because a loss is not reasonably estimable.
Goodwill and Intangible Impairment
We perform impairment testing of goodwill for each of our reporting units on an annual basis. Our reporting units are comprised of the Europe, Asia, and Americas reporting units in the International Package reporting segment, and the Forwarding & Logistics, UPS Freight, MBE / UPS Store, and UPS Capital reporting units in the Supply Chain & Freight reporting segment. Our annual goodwill impairment testing date is October 1st for each
45
reporting unit. The impairment test involves a two-step process. First, a comparison of the fair value of the applicable reporting unit with the aggregate carrying values, including goodwill, is performed. If the carrying amount of a reporting unit exceeds the reporting unit’s fair value, we perform the second step of the goodwill impairment test to determine the amount of impairment loss. The second step includes comparing the implied fair value of the affected reporting unit’s goodwill with the carrying value of that goodwill.
We primarily determine the fair value of our reporting units using a discounted cash flow model (“DCF model”), and supplement this with observable valuation multiples for comparable companies, as applicable. The completion of the DCF model requires that we make a number of significant assumptions to produce an estimate of future cash flows. These assumptions include projections of future revenue, costs and working capital changes. In addition, we make assumptions about the estimated cost of capital and other relevant variables, as required, in estimating the fair value of our reporting units. The projections that we use in our DCF model are updated annually and will change over time based on the historical performance and changing business conditions for each of our reporting units. The determination of whether goodwill is impaired involves a significant level of judgment in these assumptions, and changes in our business strategy, government regulations, or economic or market conditions could significantly impact these judgments. We will continue to monitor market conditions and other factors to determine if interim impairment tests are necessary in future periods. If impairment indicators are present in future periods, the resulting impairment charges could have a material impact on our results of operations.
In the fourth quarter of 2008, we completed our annual goodwill impairment testing and determined that our UPS Freight reporting unit, which was formed through the acquisition of Overnite Corporation in 2005, had a goodwill impairment of $548 million. This impairment charge resulted from several factors, including a lower cash flow forecast due to a longer estimated economic recovery time for the LTL sector, and significant deterioration in equity valuations for other similar LTL industry participants. At the time of acquisition of Overnite Corporation, LTL equity valuations were higher and the economy was significantly stronger. We invested in operational improvements and technology upgrades to enhance service and performance, as well as expand service offerings. However, this process took longer than initially anticipated, and thus financial results had been below our expectations. Additionally, the LTL sector in 2008 had been adversely impacted by the economic recession in the U.S., lower industrial production and retail sales, volatile fuel prices, and significant levels of price-based competition. By the fourth quarter of 2008, the combination of these internal and external factors reduced our near term expectations for this unit, leading to the goodwill impairment charge.
None of the other reporting units incurred an impairment of goodwill in 2008, nor did we have any goodwill impairment charges in 2009 or 2010. Changes in our forecasts could cause book values of our reporting units to exceed their fair values in future periods, potentially resulting in a goodwill impairment charge. A 10% decrease in the estimated fair value of our reporting units as of our most recent goodwill testing date (October 1, 2010) would not result in a goodwill impairment charge.
All of our recorded intangible assets other than goodwill are deemed to be finite-lived intangibles, and are thus amortized over their estimated useful lives. Impairment tests for these intangible assets are only performed when a triggering event occurs that indicates that the carrying value of the intangible may not be recoverable based on the undiscounted future cash flows of the intangible. If the carrying amount of the intangible is determined not to be recoverable, a write-down to fair value is recorded. Fair values are determined based on a DCF model. As a result of weak performance in our domestic U.K. package operations, we reviewed our intangible assets for impairment within our U.K. domestic package entity. Based on prior performance and near-term projections, the value assigned to the customer list intangible asset acquired within the UK domestic package business was determined to be impaired. This impairment was the result of both higher than anticipated customer turnover and reduced operating margins associated with the acquired business. Accordingly, an intangible asset impairment charge of $27 million was recorded for the year ended December 31, 2008. No other intangible asset impairments were recognized in 2008, nor were any such impairments recognized in 2009 or 2010.
46
Self-Insurance Accruals
We self-insure costs associated with workers’ compensation claims, automotive liability, health and welfare, and general business liabilities, up to certain limits. Insurance reserves are established for estimates of the loss that we will ultimately incur on reported claims, as well as estimates of claims that have been incurred but not yet reported. Recorded balances are based on reserve levels, which incorporate historical loss experience and judgments about the present and expected levels of cost per claim. Trends in actual experience are a significant factor in the determination of such reserves. We believe our estimated reserves for such claims are adequate, but actual experience in claim frequency and/or severity could materially differ from our estimates and affect our results of operations.
Workers’ compensation, automobile liability and general liability insurance claims may take several years to completely settle. Consequently, actuarial estimates are required to project the ultimate cost that will be incurred to fully resolve the claims. A number of factors can affect the actual cost of a claim, including the length of time the claim remains open, trends in health care costs and the results of related litigation. Furthermore, claims may emerge in future years for events that occurred in a prior year at a rate that differs from previous actuarial projections. Changes in state legislation with respect to workers compensation can affect the adequacy of our self-insurance accruals. All of these factors can result in revisions to prior actuarial projections and produce a material difference between estimated and actual operating results.
We sponsor a number of health and welfare insurance plans for our employees. These liabilities and related expenses are based on estimates of the number of employees and eligible dependents covered under the plans, anticipated medical usage by participants and overall trends in medical costs and inflation. Actual results may differ from these estimates and, therefore, produce a material difference between estimated and actual operating results.
Fair Value Measurements
In the normal course of business, we hold and issue financial instruments that contain elements of market risk, including derivatives, marketable securities, finance receivables, other investments, and debt. Certain of these financial instruments are required to be recorded at fair value, principally derivatives, marketable securities, pension assets, and certain other investments. Fair values are based on listed market prices, when such prices are available. To the extent that listed market prices are not available, fair value is determined based on other relevant factors, including dealer price quotations. Certain financial instruments, including over-the-counter derivative instruments, are valued using pricing models that consider, among other factors, contractual and market prices, correlations, time value, credit spreads, and yield curve volatility factors. Changes in the fixed income, equity, foreign exchange, and commodity markets will impact our estimates of fair value in the future, potentially affecting our results of operations. A quantitative sensitivity analysis of our exposure to changes in commodity prices, foreign currency exchange rates, interest rates, and equity prices is presented in the “Market Risk” section of this report.
Pension and Postretirement Medical Benefits
As discussed in Note 5 to our consolidated financial statements, we maintain several single-employer defined benefit and postretirement benefit plans. Our pension and other postretirement benefit costs are calculated using various actuarial assumptions and methodologies. These assumptions include discount rates, health care cost trend rates, inflation, compensation increase rates, expected returns on plan assets, mortality rates, and other factors. Actual results that differ from our assumptions are accumulated and amortized over future periods and, therefore, generally affect our recognized expense and recorded obligation in such future periods. We believe that the assumptions utilized in recording the obligations under our plans are reasonable, and represent our best estimates, based on information as to historical experience and performance as well as other factors that might cause future expectations to differ from past trends. Differences in actual experience or changes in assumptions may affect our pension and other postretirement obligations and future expense. A 25
47
basis point change in the assumed discount rate, expected return on assets, and health care cost trend rate for the U.S. pension and postretirement benefit plans would have resulted in the following increases (decreases) on the Company’s reported costs and obligations for the year 2010 (in millions):
| 25 Basis Point Increase |
25 Basis Point Decrease |
|||||||
| Pension Plans |
||||||||
| Discount Rate: |
||||||||
| Effect on net periodic benefit cost |
$ | (86 | ) | $ | 96 | |||
| Effect on projected benefit obligation |
(805 | ) | 854 | |||||
| Return on Assets: |
||||||||
| Effect on net periodic benefit cost |
(46 | ) | 46 | |||||
| Postretirement Medical Plans |
||||||||
| Discount Rate: |
||||||||
| Effect on net periodic benefit cost |
(6 | ) | 5 | |||||
| Effect on accumulated postretirement benefit obligation |
(92 | ) | 96 | |||||
| Health Care Cost Trend Rate: |
||||||||
| Effect on net periodic benefit cost |
3 | (3 | ) | |||||
| Effect on accumulated postretirement benefit obligation |
18 | (19 | ) | |||||
Our 2011 pension expense will be higher than our 2010 expense due primarily to two negative factors: the decline in discount rate used to determine expense from 6.58% for 2010 to 5.98% for 2011, and the required amortization of unrecognized losses, the majority of which relate to 2008 asset losses, outside of the corridor we utilize for accounting purposes. These negative factors are partially offset by the additional discretionary contributions that we made in 2010 and 2011 that increased the expected return on assets used for expense calculation purposes.
Depreciation, Residual Value, and Impairment of Fixed Assets
As of December 31, 2010, we had $17.387 billion of net fixed assets, the most significant category of which is aircraft. In accounting for fixed assets, we make estimates about the expected useful lives and the expected residual values of the assets, and the potential for impairment based on the fair values of the assets and the cash flows generated by these assets.
In estimating the lives and expected residual values of aircraft, we have relied upon actual experience with the same or similar aircraft types. Subsequent revisions to these estimates could be caused by changes to our maintenance program, changes in the utilization of the aircraft, governmental regulations on aging aircraft, and changing market prices of new and used aircraft of the same or similar types. We periodically evaluate these estimates and assumptions, and adjust the estimates and assumptions as necessary. Adjustments to the expected lives and residual values are accounted for on a prospective basis through depreciation expense.
We review long-lived assets for impairment when circumstances indicate the carrying amount of an asset may not be recoverable based on the undiscounted future cash flows of the asset. If the carrying amount of the asset is determined not to be recoverable, a write-down to fair value is recorded. Fair values are determined based on quoted market values, discounted cash flows, or external appraisals, as applicable. We review long-lived assets for impairment at the individual asset or the asset group level for which the lowest level of independent cash flows can be identified. The circumstances that would indicate potential impairment may include, but are not limited to, a significant change in the extent to which an asset is utilized, a significant decrease in the market value of an asset, and operating or cash flow losses associated with the use of the asset. In estimating cash flows, we project future volume levels for our different air express products in all geographic regions in which we do business. Adverse changes in these volume forecasts, or a shortfall of our actual volume compared with our
48
projections, could result in our current aircraft capacity exceeding current or projected demand. This situation would lead to an excess of a particular aircraft type, resulting in an aircraft impairment charge or a reduction of the expected life of an aircraft type (thus resulting in increased depreciation expense).
In 2008, we had announced that we were in negotiations with DHL to provide air transportation services for all of DHL’s express, deferred and international package volume within the United States, as well as air transportation services between the United States, Canada and Mexico. In early April 2009, UPS and DHL mutually agreed to terminate further discussions on providing these services. Additionally, our U.S. Domestic Package air delivery volume had declined for several quarters as a result of persistent economic weakness and shifts in product mix from our premium air services to our lower cost ground services. As a result of these factors, the utilization of certain aircraft fleet types had declined and was expected to be lower in the future.
Based on the factors noted above, as well as FAA aging aircraft directives that would require significant future maintenance expenditures, we determined that a triggering event had occurred that required an impairment assessment of our McDonnell-Douglas DC-8-71 and DC-8-73 aircraft fleets. We conducted an impairment analysis as of March 31, 2009, and determined that the carrying amount of these fleets was not recoverable due to the accelerated expected retirement dates of the aircraft. Based on anticipated residual values for the airframes, engines, and parts, we recognized an impairment charge of $181 million in the first quarter of 2009. The DC-8 fleets were subsequently retired from service.
Income Taxes
We make certain estimates and judgments in determining income tax expense for financial statement purposes. These estimates and judgments occur in the calculation of income by legal entity and jurisdiction, tax credits, benefits, and deductions, and in the calculation of certain tax assets and liabilities, which arise from differences in the timing of recognition of revenue and expense for tax and financial statement purposes, as well as the interest and penalties related to these uncertain tax positions. Significant changes to these estimates may result in an increase or decrease to our tax provision in a subsequent period.
We assess the likelihood that we will be able to recover our deferred tax assets. If recovery is not likely, we must increase our provision for taxes by recording a valuation allowance against the deferred tax assets that we estimate will not ultimately be recoverable. We believe that we will ultimately recover a substantial majority of the deferred tax assets recorded on our consolidated balance sheets. However, should there be a change in our ability to recover our deferred tax assets, our tax provision would increase in the period in which we determined that the recovery was not likely.
The calculation of our tax liabilities involves dealing with uncertainties in the application of complex tax regulations. We recognize liabilities for uncertain tax positions based on a two-step process. The first step is to evaluate the tax position for recognition by determining if the weight of available evidence indicates that it is more likely than not that the position will be sustained on audit, including resolution of related appeals or litigation processes, if any. Once it is determined that the position meets the recognition threshold, the second step requires us to estimate and measure the tax benefit as the largest amount that is more likely than not to be realized upon ultimate settlement. It is inherently difficult and subjective to estimate such amounts, as we have to determine the probability of various possible outcomes. We reevaluate these uncertain tax positions on a quarterly basis. This evaluation is based on factors including, but not limited to, changes in facts or circumstances, changes in tax law, effectively settled issues under audit, and new audit activity. Such a change in recognition or measurement could result in the recognition of a tax benefit or an additional charge to the tax provision.
Allowance for Doubtful Accounts
Losses on accounts receivable are recognized when they are incurred, which requires us to make our best estimate of the probable losses inherent in our customer receivables at each balance sheet date. These estimates
49
require consideration of historical loss experience, adjusted for current conditions, trends in customer payment frequency, and judgments about the probable effects of relevant observable data, including present economic conditions and the financial health of specific customers and market sectors. Our risk management process includes standards and policies for reviewing major account exposures and concentrations of risk. Deterioration in macro economic variables could result in our ultimate loss exposures on our accounts receivable being significantly higher than what we have currently estimated and reserved for in our allowance for doubtful accounts. Our total allowance for doubtful accounts as of December 31, 2010 and 2009 was $127 and $138 million, respectively. Our total provision for doubtful accounts charged to expense during the years ended December 31, 2010, 2009 and 2008 was $199, $254 and $277 million, respectively.
| Item 7A. | Quantitative and Qualitative Disclosures about Market Risk |
We are exposed to market risk from changes in certain commodity prices, foreign currency exchange rates, interest rates, and equity prices. All of these market risks arise in the normal course of business, as we do not engage in speculative trading activities. In order to manage the risk arising from these exposures, we utilize a variety of commodity, foreign exchange, and interest rate forward contracts, options, and swaps. A discussion of our accounting policies for derivative instruments and further disclosures are provided in Note 14 to the consolidated financial statements.
Commodity Price Risk
We are exposed to changes in the prices of refined fuels, principally jet-A, diesel, and unleaded gasoline. Currently, the fuel surcharges that we apply to our domestic and international package and LTL services are the primary means of reducing the risk of adverse fuel price changes. Additionally, we periodically use a combination of option contracts to provide partial protection from changing fuel and energy prices. As of December 31, 2010 and 2009, however, we had no commodity option contracts outstanding.
In the fourth quarter of 2008, we terminated several energy derivatives and received $87 million in cash. This transaction was reported in other investing activities in the statements of consolidated cash flows. As these derivatives qualified for hedge accounting, were designated as hedges, and maintained their effectiveness, the gains associated with these hedges were recognized in income over the original term of the hedges, which extended through the first quarter of 2009.
Foreign Currency Exchange Risk
We have foreign currency risks related to our revenue, operating expenses, and financing transactions in currencies other than the local currencies in which we operate. We are exposed to currency risk from the potential changes in functional currency values of our foreign currency-denominated assets, liabilities, and cash flows. Our most significant foreign currency exposures relate to the Euro, the British Pound Sterling and the Canadian Dollar. We use a combination of purchased and written options and forward contracts to hedge forecasted cash flow currency exposures. These derivative instruments generally cover forecasted foreign currency exposures for periods of 12 to 24 months. Additionally, we utilize cross-currency interest rate swaps to hedge the currency risk inherent in the interest and principal payments associated with foreign currency denominated debt obligations. The term of these swap agreements is commensurate with the underlying debt obligations.
Interest Rate Risk
We have issued debt instruments, including debt associated with capital leases, that accrue expense at fixed and floating rates of interest. We use a combination of interest rate swaps as part of our program to manage the fixed and floating interest rate mix of our total debt portfolio and related overall cost of borrowing. The notional amount, interest payment, and maturity dates of the swaps match the terms of the associated debt. We also utilize
50
forward starting swaps and similar instruments to lock in all or a portion of the borrowing cost of anticipated debt issuances. Our floating rate debt and interest rate swaps subject us to risk resulting from changes in short-term (primarily LIBOR) interest rates.
We also are subject to interest rate risk with respect to our pension and postretirement benefit obligations, as changes in interest rates will effectively increase or decrease our liabilities associated with these benefit plans, which also results in changes to the amount of pension and postretirement benefit expense recognized in future periods.
We have investments in debt and preferred equity securities (including auction rate securities), as well as cash-equivalent instruments, some of which accrue income at variable rates of interest. Additionally, we hold a portfolio of finance receivables that accrue income at fixed and floating rates of interest.
Equity Price Risk
We hold investments in various common equity securities that are subject to price risk. These securities are primarily in the form of equity index funds.
Credit Risk
The forward contracts, swaps, and options previously discussed contain an element of risk that the counterparties may be unable to meet the terms of the agreements. However, we minimize such risk exposures for these instruments by limiting the counterparties to financial institutions that meet established credit guidelines. We do not expect to incur any material losses as a result of counterparty default.
Sensitivity Analysis
The following analysis provides quantitative information regarding our exposure to commodity price risk, foreign currency exchange risk, interest rate risk, and equity price risk embedded in our existing financial instruments. We utilize valuation models to evaluate the sensitivity of the fair value of financial instruments with exposure to market risk that assume instantaneous, parallel shifts in exchange rates, interest rate yield curves, and commodity and equity prices. For options and instruments with non-linear returns, models appropriate to the instrument are utilized to determine the impact of market shifts.
There are certain limitations inherent in the sensitivity analyses presented, primarily due to the assumption that exchange rates change in a parallel fashion and that interest rates change instantaneously. In addition, the analyses are unable to reflect the complex market reactions that normally would arise from the market shifts modeled. While this is our best estimate of the impact of the specified interest rate scenarios, these estimates should not be viewed as forecasts. We adjust the fixed and floating interest rate mix of our interest rate sensitive assets and liabilities in response to changes in market conditions. Additionally, changes in the fair value of foreign currency derivatives and commodity derivatives are offset by changes in the cash flows of the underlying hedged foreign currency and commodity transactions.
| Shock-Test Result | ||||||||
| (in millions) | 2010 | 2009 | ||||||
| Change in Fair Value: |
||||||||
| Currency Derivatives(1) |
$ | (89 | ) | $ | (16 | ) | ||
| Change in Annual Expense: |
||||||||
| Variable Rate Debt(2) |
$ | 10 | $ | 14 | ||||
| Interest Rate Derivatives(2) |
$ | 58 | $ | 38 | ||||
| (1) | The potential change in fair value from a hypothetical 10% weakening of the U.S. Dollar against local currency exchange rates across all maturities. |
| (2) | The potential change in annual interest expense resulting from a hypothetical 100 basis point increase in short-term interest rates, applied to our variable rate debt and swap instruments (excluding hedges of anticipated debt issuances). |
51
The sensitivity of our pension and postretirement benefit obligations to changes in interest rates is quantified in “Critical Accounting Policies and Estimates”. The sensitivity in the fair value and interest income of our marketable securities due to changes in equity prices and interest rates, respectively, was not material as of December 31, 2010 or 2009. The sensitivity in the fair value and interest income of our finance receivables due to changes in interest rates was also not material as of December 31, 2010 or 2009.
52
| Item 8. | Financial Statements and Supplementary Data |
Report of Independent Registered Public Accounting Firm
Board of Directors and Shareowners
United Parcel Service, Inc.
Atlanta, Georgia
We have audited the internal control over financial reporting of United Parcel Service, Inc. and subsidiaries (the “Company”) as of December 31, 2010, based on criteria established in Internal Control—Integrated Framework issued by the Committee of Sponsoring Organizations of the Treadway Commission. The Company’s management is responsible for maintaining effective internal control over financial reporting and for its assessment of the effectiveness of internal control over financial reporting, included in the accompanying Management’s Report on Internal Control Over Financial Reporting. Our responsibility is to express an opinion on the Company’s internal control over financial reporting based on our audit.
We conducted our audit in accordance with the standards of the Public Company Accounting Oversight Board (United States). Those standards require that we plan and perform the audit to obtain reasonable assurance about whether effective internal control over financial reporting was maintained in all material respects. Our audit included obtaining an understanding of internal control over financial reporting, assessing the risk that a material weakness exists, testing and evaluating the design and operating effectiveness of internal control based on the assessed risk, and performing such other procedures as we considered necessary in the circumstances. We believe that our audit provides a reasonable basis for our opinion.
A company’s internal control over financial reporting is a process designed by, or under the supervision of, the company’s principal executive and principal financial officers, or persons performing similar functions, and effected by the company’s board of directors, management, and other personnel to provide reasonable assurance regarding the reliability of financial reporting and the preparation of financial statements for external purposes in accordance with generally accepted accounting principles. A company’s internal control over financial reporting includes those policies and procedures that (1) pertain to the maintenance of records that, in reasonable detail, accurately and fairly reflect the transactions and dispositions of the assets of the company; (2) provide reasonable assurance that transactions are recorded as necessary to permit preparation of financial statements in accordance with generally accepted accounting principles, and that receipts and expenditures of the company are being made only in accordance with authorizations of management and directors of the company; and (3) provide reasonable assurance regarding prevention or timely detection of unauthorized acquisition, use, or disposition of the company’s assets that could have a material effect on the financial statements.
Because of the inherent limitations of internal control over financial reporting, including the possibility of collusion or improper management override of controls, material misstatements due to error or fraud may not be prevented or detected on a timely basis. Also, projections of any evaluation of the effectiveness of the internal control over financial reporting to future periods are subject to the risk that the controls may become inadequate because of changes in conditions, or that the degree of compliance with the policies or procedures may deteriorate.
In our opinion, the Company maintained, in all material respects, effective internal control over financial reporting as of December 31, 2010, based on the criteria established in Internal Control—Integrated Framework issued by the Committee of Sponsoring Organizations of the Treadway Commission.
We have also audited, in accordance with the standards of the Public Company Accounting Oversight Board (United States), the consolidated balance sheet of United Parcel Service, Inc. and its subsidiaries as of December 31, 2010, and the related statements of consolidated income, comprehensive income (loss), and cash flows for the year ended December 31, 2010 and our report dated February 28, 2011 expressed an unqualified opinion on those financial statements.
/s/ Deloitte & Touche LLP
Atlanta, Georgia
February 28, 2011
53
Report of Independent Registered Public Accounting Firm
Board of Directors and Shareowners
United Parcel Service, Inc.
Atlanta, Georgia
We have audited the accompanying consolidated balance sheets of United Parcel Service, Inc. and subsidiaries (the “Company”) as of December 31, 2010 and 2009, and the related statements of consolidated income, comprehensive income (loss), and cash flows for each of the three years in the period ended December 31, 2010. These consolidated financial statements are the responsibility of the Company’s management. Our responsibility is to express an opinion on these financial statements based on our audits.
We conducted our audits in accordance with the standards of the Public Company Accounting Oversight Board (United States). Those standards require that we plan and perform the audit to obtain reasonable assurance about whether the financial statements are free of material misstatement. An audit includes examining, on a test basis, evidence supporting the amounts and disclosures in the financial statements. An audit also includes assessing the accounting principles used and significant estimates made by management, as well as evaluating the overall financial statement presentation. We believe that our audits provide a reasonable basis for our opinion.
In our opinion, such consolidated financial statements present fairly, in all material respects, the financial position of United Parcel Service Inc. and subsidiaries at December 31, 2010 and 2009, and the results of their operations and their cash flows for each of the three years in the period ended December 31, 2010, in conformity with accounting principles generally accepted in the United States of America.
We have also audited, in accordance with the standards of the Public Company Accounting Oversight Board (United States), the Company’s internal control over financial reporting as of December 31, 2010, based on the criteria established in Internal Control—Integrated Framework issued by the Committee of Sponsoring Organizations of the Treadway Commission and our report dated February 28, 2011 expressed an unqualified opinion on the Company’s internal control over financial reporting.
/s/ Deloitte & Touche LLP
Atlanta, Georgia
February 28, 2011
54
UNITED PARCEL SERVICE, INC. AND SUBSIDIARIES
CONSOLIDATED BALANCE SHEETS
(In millions)
| December 31, | ||||||||
| 2010 | 2009 | |||||||
| ASSETS | ||||||||
| Current Assets: |
||||||||
| Cash and cash equivalents |
$ | 3,370 | $ | 1,542 | ||||
| Marketable securities |
711 | 558 | ||||||
| Accounts receivable, net |
5,627 | 5,369 | ||||||
| Finance receivables, net |
203 | 287 | ||||||
| Deferred income tax assets |
659 | 585 | ||||||
| Income taxes receivable |
287 | 266 | ||||||
| Other current assets |
712 | 668 | ||||||
| Total Current Assets |
11,569 | 9,275 | ||||||
| Property, Plant and Equipment, Net |
17,387 | 17,979 | ||||||
| Goodwill |
2,081 | 2,089 | ||||||
| Intangible Assets, Net |
599 | 596 | ||||||
| Non-Current Finance Receivables, Net |
288 | 337 | ||||||
| Non-Current Investments and Restricted Cash |
458 | 533 | ||||||
| Other Non-Current Assets |
1,215 | 1,074 | ||||||
| Total Assets |
$ | 33,597 | $ | 31,883 | ||||
| LIABILITIES AND SHAREOWNERS’ EQUITY | ||||||||
| Current Liabilities: |
||||||||
| Current maturities of long-term debt and commercial paper |
$ | 355 | $ | 853 | ||||
| Accounts payable |
1,974 | 1,766 | ||||||
| Accrued wages and withholdings |
1,505 | 1,416 | ||||||
| Self-insurance reserves |
725 | 757 | ||||||
| Other current liabilities |
1,343 | 1,447 | ||||||
| Total Current Liabilities |
5,902 | 6,239 | ||||||
| Long-Term Debt |
10,491 | 8,668 | ||||||
| Pension and Postretirement Benefit Obligations |
4,663 | 5,457 | ||||||
| Deferred Income Tax Liabilities |
1,870 | 1,293 | ||||||
| Self-Insurance Reserves |
1,809 | 1,732 | ||||||
| Other Non-Current Liabilities |
815 | 798 | ||||||
| Shareowners’ Equity: |
||||||||
| Class A common stock (258 and 285 shares issued in 2010 and 2009) |
3 | 3 | ||||||
| Class B common stock (735 and 711 shares issued in 2010 and 2009) |
7 | 7 | ||||||
| Additional paid-in capital |
— | 2 | ||||||
| Retained earnings |
14,164 | 12,745 | ||||||
| Accumulated other comprehensive loss |
(6,195 | ) | (5,127 | ) | ||||
| Deferred compensation obligations |
103 | 108 | ||||||
| Less: Treasury stock (2 shares in 2010 and 2009) |
(103 | ) | (108 | ) | ||||
| Total Equity for Controlling Interests |
7,979 | 7,630 | ||||||
| Noncontrolling Interests |
68 | 66 | ||||||
| Total Shareowners’ Equity |
8,047 | 7,696 | ||||||
| Total Liabilities and Shareowners’ Equity |
$ | 33,597 | $ | 31,883 | ||||
See notes to consolidated financial statements.
55
UNITED PARCEL SERVICE, INC. AND SUBSIDIARIES
STATEMENTS OF CONSOLIDATED INCOME
(In millions, except per share amounts)
| Years Ended December 31, | ||||||||||||
| 2010 | 2009 | 2008 | ||||||||||
| Revenue |
$ | 49,545 | $ | 45,297 | $ | 51,486 | ||||||
| Operating Expenses: |
||||||||||||
| Compensation and benefits |
26,324 | 25,640 | 26,063 | |||||||||
| Repairs and maintenance |
1,131 | 1,075 | 1,194 | |||||||||
| Depreciation and amortization |
1,792 | 1,747 | 1,814 | |||||||||
| Purchased transportation |
6,640 | 5,379 | 6,550 | |||||||||
| Fuel |
2,972 | 2,365 | 4,134 | |||||||||
| Other occupancy |
939 | 985 | 1,027 | |||||||||
| Other expenses |
3,873 | 4,305 | 5,322 | |||||||||
| Total Operating Expenses |
43,671 | 41,496 | 46,104 | |||||||||
| Operating Profit |
5,874 | 3,801 | 5,382 | |||||||||
| Other Income and (Expense): |
||||||||||||
| Investment income |
3 | 10 | 75 | |||||||||
| Interest expense |
(354 | ) | (445 | ) | (442 | ) | ||||||
| Total Other Income and (Expense) |
(351 | ) | (435 | ) | (367 | ) | ||||||
| Income Before Income Taxes |
5,523 | 3,366 | 5,015 | |||||||||
| Income Tax Expense |
2,035 | 1,214 | 2,012 | |||||||||
| Net Income |
$ | 3,488 | $ | 2,152 | $ | 3,003 | ||||||
| Basic Earnings Per Share |
$ | 3.51 | $ | 2.16 | $ | 2.96 | ||||||
| Diluted Earnings Per Share |
$ | 3.48 | $ | 2.14 | $ | 2.94 | ||||||
STATEMENTS OF CONSOLIDATED COMPREHENSIVE INCOME (LOSS)
(In millions)
| Years Ended December 31, | ||||||||||||
| 2010 | 2009 | 2008 | ||||||||||
| Net income |
$ | 3,488 | $ | 2,152 | $ | 3,003 | ||||||
| Change in foreign currency translation adjustment |
(105 | ) | 75 | (119 | ) | |||||||
| Change in unrealized gain (loss) on marketable securities, net of tax |
39 | 33 | (69 | ) | ||||||||
| Change in unrealized gain (loss) on cash flow hedges, net of tax |
(39 | ) | (93 | ) | 143 | |||||||
| Change in unrecognized pension and postretirement benefit costs, net of tax |
(963 | ) | 500 | (3,597 | ) | |||||||
| Comprehensive income (loss) |
$ | 2,420 | $ | 2,667 | $ | (639 | ) | |||||
See notes to consolidated financial statements.
56
UNITED PARCEL SERVICE, INC. AND SUBSIDIARIES
STATEMENTS OF CONSOLIDATED CASH FLOWS
(In millions)
| Years Ended December 31, | ||||||||||||
| 2010 | 2009 | 2008 | ||||||||||
| Cash Flows From Operating Activities: |
||||||||||||
| Net income |
$ | 3,488 | $ | 2,152 | $ | 3,003 | ||||||
| Adjustments to reconcile net income to net cash from operating activities: |
||||||||||||
| Depreciation and amortization |
1,792 | 1,747 | 1,814 | |||||||||
| Pension and postretirement benefit expense |
903 | 872 | 726 | |||||||||
| Pension and postretirement benefit contributions |
(3,240 | ) | (924 | ) | (246 | ) | ||||||
| Self-insurance reserves |
45 | 47 | 87 | |||||||||
| Deferred taxes, credits and other |
1,002 | 471 | 187 | |||||||||
| Stock compensation expense |
519 | 430 | 516 | |||||||||
| Asset impairment charges |
— | 181 | 575 | |||||||||
| Other (gains) losses |
(13 | ) | 115 | 634 | ||||||||
| Changes in assets and liabilities, net of effect of acquisitions: |
||||||||||||
| Accounts receivable |
(532 | ) | (30 | ) | 197 | |||||||
| Income taxes receivable |
(146 | ) | 27 | 1,161 | ||||||||
| Other current assets |
(60 | ) | 136 | (144 | ) | |||||||
| Accounts payable |
265 | (107 | ) | 87 | ||||||||
| Accrued wages and withholdings |
98 | (102 | ) | 44 | ||||||||
| Other current liabilities |
(284 | ) | 184 | (184 | ) | |||||||
| Other operating activities |
(2 | ) | 86 | (31 | ) | |||||||
| Net cash from operating activities |
3,835 | 5,285 | 8,426 | |||||||||
| Cash Flows From Investing Activities: |
||||||||||||
| Capital expenditures |
(1,389 | ) | (1,602 | ) | (2,636 | ) | ||||||
| Proceeds from disposals of property, plant and equipment |
304 | 60 | 147 | |||||||||
| Purchases of marketable securities |
(2,490 | ) | (2,251 | ) | (3,391 | ) | ||||||
| Sales and maturities of marketable securities |
2,520 | 2,240 | 3,113 | |||||||||
| Net (increase) decrease in finance receivables |
108 | 261 | (49 | ) | ||||||||
| Other investing activities |
293 | 44 | (363 | ) | ||||||||
| Net cash used in investing activities |
(654 | ) | (1,248 | ) | (3,179 | ) | ||||||
| Cash Flows From Financing Activities: |
||||||||||||
| Net change in short-term debt |
(481 | ) | (1,738 | ) | (2,016 | ) | ||||||
| Proceeds from long-term borrowings |
2,195 | 3,160 | 3,613 | |||||||||
| Repayments of long-term borrowings |
(468 | ) | (1,944 | ) | (2,518 | ) | ||||||
| Purchases of common stock |
(817 | ) | (561 | ) | (3,570 | ) | ||||||
| Issuances of common stock |
218 | 149 | 169 | |||||||||
| Dividends |
(1,818 | ) | (1,751 | ) | (2,219 | ) | ||||||
| Other financing activities |
(175 | ) | (360 | ) | (161 | ) | ||||||
| Net cash used in financing activities |
(1,346 | ) | (3,045 | ) | (6,702 | ) | ||||||
| Effect Of Exchange Rate Changes On Cash And Cash Equivalents |
(7 | ) | 43 | (65 | ) | |||||||
| Net Increase (Decrease) In Cash And Cash Equivalents |
1,828 | 1,035 | (1,520 | ) | ||||||||
| Cash And Cash Equivalents: |
||||||||||||
| Beginning of period |
1,542 | 507 | 2,027 | |||||||||
| End of period |
$ | 3,370 | $ | 1,542 | $ | 507 | ||||||
| Cash Paid During The Period For: |
||||||||||||
| Interest (net of amount capitalized) |
$ | 340 | $ | 390 | $ | 359 | ||||||
| Income taxes |
$ | 1,312 | $ | 443 | $ | 760 | ||||||
See notes to consolidated financial statements.
57
UNITED PARCEL SERVICE, INC. AND SUBSIDIARIES
NOTES TO CONSOLIDATED FINANCIAL STATEMENTS
NOTE 1. SUMMARY OF ACCOUNTING POLICIES
Basis of Financial Statements and Business Activities
The accompanying consolidated financial statements have been prepared in accordance with accounting principles generally accepted in the United States (“GAAP”). The accompanying consolidated financial statements include the accounts of United Parcel Service, Inc., and all of its consolidated subsidiaries (collectively “UPS” or the “Company”). All intercompany balances and transactions have been eliminated.
UPS concentrates its operations in the field of transportation services, primarily domestic and international letter and package delivery. Through our Supply Chain & Freight subsidiaries, we are also a global provider of specialized transportation, logistics, and financial services.
Use of Estimates
The preparation of our consolidated financial statements requires the use of estimates and assumptions that affect the reported amounts of assets and liabilities, the reported amounts of revenues and expenses and the disclosure of contingencies. Estimates have been prepared on the basis of the most current and best information, and actual results could differ materially from those estimates.
Revenue Recognition
U.S. Domestic and International Package Operations—Revenue is recognized upon delivery of a letter or package.
Forwarding and Logistics—Freight forwarding revenue and the expense related to the transportation of freight are recognized at the time the services are performed. Material management and distribution revenue is recognized upon performance of the service provided. Customs brokerage revenue is recognized upon completing documents necessary for customs entry purposes.
Freight—Revenue is recognized upon delivery of a less-than-truckload (“LTL”) or truckload (“TL”) shipment.
We utilize independent contractors and third party carriers in the performance of some transportation services. In situations where we act as principal party to the transaction, we recognize revenue on a gross basis; in circumstances where we act as an agent, we recognize revenue net of the cost of the purchased transportation.
Financial Services—Income on loans and direct finance leases is recognized on the effective interest method. Accrual of interest income is suspended at the earlier of the time at which collection of an account becomes doubtful or the account becomes 90 days delinquent. Income on operating leases is recognized on the straight-line method over the terms of the underlying leases.
Cash and Cash Equivalents
Cash and cash equivalents consist of highly liquid investments that are readily convertible into cash. We consider securities with maturities of three months or less, when purchased, to be cash equivalents. The carrying amount of these securities approximates fair value because of the short-term maturity of these instruments.
58
UNITED PARCEL SERVICE, INC. AND SUBSIDIARIES
NOTES TO CONSOLIDATED FINANCIAL STATEMENTS—(Continued)
Investments
Marketable securities are classified as available-for-sale and are carried at fair value, with related unrealized gains and losses reported, net of tax, as accumulated other comprehensive income (“AOCI”), a separate component of shareowners’ equity. The amortized cost of debt securities is adjusted for amortization of premiums and accretion of discounts to maturity. Such amortization and accretion is included in investment income, along with interest and dividends. The cost of securities sold is based on the specific identification method; realized gains and losses resulting from such sales are included in investment income.
We periodically review our investments for indications of other than temporary impairment considering many factors, including the extent and duration to which a security’s fair value has been less than its cost, overall economic and market conditions, and the financial condition and specific prospects for the issuer. Impairment of investment securities results in a charge to income when a market decline below cost is other than temporary.
Accounts Receivable
Losses on accounts receivable are recognized when they are incurred, which requires us to make our best estimate of the probable losses inherent in our customer receivables at each balance sheet date. These estimates require consideration of historical loss experience, adjusted for current conditions, trends in customer payment frequency, and judgments about the probable effects of relevant observable data, including present economic conditions and the financial health of specific customers and market sectors. Our risk management process includes standards and policies for reviewing major account exposures and concentrations of risk.
Our total allowance for doubtful accounts as of December 31, 2010 and 2009 was $127 and $138 million, respectively. Our total provision for doubtful accounts charged to expense during the years ended December 31, 2010, 2009 and 2008 was $199, $254 and $277 million, respectively.
Inventories
Jet fuel, diesel, and unleaded gasoline inventories are valued at the lower of average cost or market. Fuel and other materials and supplies inventories are recognized as inventory when purchased, and then charged to expense when used in our operations. Total inventories were $319 and $281 million as of December 31, 2010 and 2009, respectively, and are included in “other current assets” on the consolidated balance sheet.
Property, Plant and Equipment
Property, plant and equipment are carried at cost. Depreciation and amortization are provided by the straight-line method over the estimated useful lives of the assets, which are as follows: Vehicles—6 to 15 years; Aircraft—12 to 30 years; Buildings—20 to 40 years; Leasehold Improvements—terms of leases; Plant Equipment—6 to 8 1/4 years; Technology Equipment—3 to 5 years. The costs of major airframe and engine overhauls, as well as routine maintenance and repairs, are charged to expense as incurred.
Interest incurred during the construction period of certain property, plant and equipment is capitalized until the underlying assets are placed in service, at which time amortization of the capitalized interest begins, straight-line, over the estimated useful lives of the related assets. Capitalized interest was $18, $37 and $48 million for 2010, 2009, and 2008, respectively.
59
UNITED PARCEL SERVICE, INC. AND SUBSIDIARIES
NOTES TO CONSOLIDATED FINANCIAL STATEMENTS—(Continued)
We review long-lived assets for impairment when circumstances indicate the carrying amount of an asset may not be recoverable based on the undiscounted future cash flows of the asset. If the carrying amount of the asset is determined not to be recoverable, a write-down to fair value is recorded. Fair values are determined based on quoted market values, discounted cash flows, or external appraisals, as applicable. We review long-lived assets for impairment at the individual asset or the asset group level for which the lowest level of independent cash flows can be identified.
Goodwill and Intangible Assets
Costs of purchased businesses in excess of net identifiable assets acquired (goodwill), and indefinite-lived intangible assets are tested for impairment at least annually, unless changes in circumstances indicate an impairment may have occurred sooner. We are required to test goodwill on a “reporting unit” basis. A reporting unit is the operating segment unless, for businesses within that operating segment, discrete financial information is prepared and regularly reviewed by management, in which case such a component business is the reporting unit.
A fair value approach is used to test goodwill for impairment. An impairment charge is recognized for the amount, if any, by which the carrying amount of goodwill exceeds its fair value. We primarily determine the fair value of our reporting units using a discounted cash flow model, and supplement this with observable valuation multiples for comparable companies, as applicable.
Finite-lived intangible assets, including trademarks, licenses, patents, customer lists, non-compete agreements, and franchise rights are amortized on a straight-line basis over the estimated useful lives of the assets, which range from 2 to 20 years. Capitalized software is amortized over periods ranging from 3 to 5 years.
Self-Insurance Accruals
We self-insure costs associated with workers’ compensation claims, automotive liability, health and welfare, and general business liabilities, up to certain limits. Insurance reserves are established for estimates of the loss that we will ultimately incur on reported claims, as well as estimates of claims that have been incurred but not yet reported. Recorded balances are based on reserve levels, which incorporate historical loss experience and judgments about the present and expected levels of cost per claim.
Pension and Postretirement Benefits
We incur certain employment-related expenses associated with pension and postretirement medical benefits. These pension and postretirement medical benefit costs for company-sponsored benefit plans are calculated using various actuarial assumptions and methodologies, including discount rates, expected returns on plan assets,
60
UNITED PARCEL SERVICE, INC. AND SUBSIDIARIES
NOTES TO CONSOLIDATED FINANCIAL STATEMENTS—(Continued)
health care cost trend rates, inflation, compensation increase rates, mortality rates, and other factors. Actuarial assumptions are reviewed on an annual basis, unless circumstances require an interim remeasurement date for any of our plans.
We participate in a number of trustee-managed multi-employer pension and health and welfare plans for employees covered under collective bargaining agreements. Our contributions to these plans are determined in accordance with the respective collective bargaining agreements. We recognize expense for the contractually required contribution for each period, and we recognize a liability for any contributions due and unpaid (included in “other current liabilities”).
Income Taxes
Income taxes are accounted for on an asset and liability approach that requires the recognition of deferred tax assets and liabilities for the expected future tax consequences of events that have been recognized in our consolidated financial statements or tax returns. In estimating future tax consequences, we generally consider all expected future events other than proposed changes in the tax law or rates. Valuation allowances are provided if it is more likely than not that a deferred tax asset will not be realized.
We recognize liabilities for uncertain tax positions based on a two-step process. The first step is to evaluate the tax position for recognition by determining if the weight of available evidence indicates that it is more likely than not that the position will be sustained on audit, including resolution of related appeals or litigation processes, if any. Once it is determined that the position meets the recognition threshold, the second step requires us to estimate and measure the tax benefit as the largest amount that is more likely than not to be realized upon ultimate settlement. It is inherently difficult and subjective to estimate such amounts, as we have to determine the probability of various possible outcomes. We reevaluate these uncertain tax positions on a quarterly basis. This evaluation is based on factors including, but not limited to, changes in facts or circumstances, changes in tax law, effectively settled issues under audit, and new audit activity. Such a change in recognition or measurement could result in the recognition of a tax benefit or an additional charge to the tax provision.
Foreign Currency Translation
We translate the results of operations of our foreign subsidiaries using average exchange rates during each period, whereas balance sheet accounts are translated using exchange rates at the end of each period. Balance sheet currency translation adjustments are recorded in AOCI. Net currency transaction gains and losses included in other operating expenses were pre-tax gains (losses) of $7, $(45) and $46 million in 2010, 2009 and 2008, respectively.
Stock-Based Compensation
All share-based awards to employees are to be measured based on their fair values and expensed over the period during which an employee is required to provide service in exchange for the award (the vesting period). We issue employee share-based awards under the UPS Incentive Compensation Plan that are subject to specific vesting conditions; generally, the awards cliff vest or vest ratably over a five year period, “the nominal vesting period,” or at the date the employee retires (as defined by the plan), if earlier. Compensation cost is recognized immediately for awards granted to retirement-eligible employees, or over the period from the grant date to the date retirement eligibility is achieved, if that is expected to occur during the nominal vesting period.
61
UNITED PARCEL SERVICE, INC. AND SUBSIDIARIES
NOTES TO CONSOLIDATED FINANCIAL STATEMENTS—(Continued)
Fair Value Measurements
Our financial assets and liabilities measured at fair value on a recurring basis have been categorized based upon a fair value hierarchy. Level 1 inputs utilize quoted prices in active markets for identical assets or liabilities. Level 2 inputs are based on other observable market data, such as quoted prices for similar assets and liabilities, and inputs other than quoted prices that are observable, such as interest rates and yield curves. Level 3 inputs are developed from unobservable data reflecting our own assumptions, and include situations where there is little or no market activity for the asset or liability.
Certain non-financial assets and liabilities are measured at fair value on a nonrecurring basis, including property, plant, and equipment, goodwill, and intangible assets. These assets are not measured at fair value on a recurring basis; however, they are subject to fair value adjustments in certain circumstances, such as when there is evidence of an impairment. A general description of the valuation methodologies used for assets and liabilities measured at fair value, including the general classification of such assets and liabilities pursuant to the valuation hierarchy, is included in each footnote with fair value measurements present.
Derivative Instruments
All financial derivative instruments are recorded on our balance sheet at fair value. Derivatives not designated as hedges must be adjusted to fair value through income. If a derivative is designated as a hedge, depending on the nature of the hedge, changes in its fair value that are considered to be effective, as defined, either offset the change in fair value of the hedged assets, liabilities, or firm commitments through income, or are recorded in AOCI until the hedged item is recorded in income. Any portion of a change in a derivative’s fair value that is considered to be ineffective, or is excluded from the measurement of effectiveness, is recorded immediately in income.
Recently Adopted Accounting Standards
Provisions within the following accounting standards were adopted during the years covered by these consolidated financial statements:
Financial Instruments: The Financial Accounting Standards Board (“FASB”) issued guidance in February 2007 that gives entities the option to measure eligible financial assets, financial liabilities and firm commitments at fair value (i.e., the fair value option), on an instrument-by-instrument basis, that are otherwise not accounted for at fair value under other accounting standards. The election to use the fair value option is available at specified election dates, such as when an entity first recognizes a financial asset or financial liability or upon entering into a firm commitment. Subsequent changes in fair value must be recorded in earnings. Additionally, this guidance allowed for a one-time election for existing positions upon adoption, with the transition adjustment recorded to beginning retained earnings. We adopted this standard on January 1, 2008, and elected to apply the fair value option to our investment in certain investment partnerships that were previously accounted for under the equity method. Accordingly, we recorded a $16
62
UNITED PARCEL SERVICE, INC. AND SUBSIDIARIES
NOTES TO CONSOLIDATED FINANCIAL STATEMENTS—(Continued)
million reduction to retained earnings as of January 1, 2008. These investments are reported in “other non-current assets” on the consolidated balance sheets.
Compensation-Retirement Benefits: We previously utilized the early measurement date option available in accounting for our pension and postretirement medical benefit plans, and we measured the funded status of our plans as of September 30 each year. Under guidance issued by the FASB, we were required to use a December 31 measurement date for all of our pension and postretirement benefit plans beginning in 2008. As a result of this change in measurement date, we recorded a cumulative effect after-tax $44 million reduction to retained earnings as of January 1, 2008.
Beginning in 2009, new guidance was adopted that required disclosures about plan assets of a defined benefit pension or other postretirement plan, investment policies and strategies, major categories of plan assets, inputs and valuation techniques used to measure the fair value of plan assets and significant concentrations of risk within plan assets. These disclosures are provided in Note 5 to the consolidated financial statements.
Fair Value Measurements and Disclosures: The FASB issued guidance on fair value measurements that took effect on January 1, 2008 and are presented in Notes 2, 3, 4, 5, and 14 to the consolidated financial statements. On January 1, 2009, we implemented the previously deferred provisions of this guidance for nonfinancial assets and liabilities recorded at fair value. The accounting requirements for determining fair value when the volume and level of activity for an asset or liability have significantly decreased, and for identifying transactions that are not orderly, contained the FASB’s guidance were adopted on April 1, 2009, but had an immaterial impact on our consolidated financial statements.
Derivatives and Hedging: The FASB issued certain disclosure requirements for derivatives and hedging transactions that took effect on January 1, 2009 and are presented in Note 14.
Business Combinations: The FASB issued new accounting requirements for business combinations, which took effect on January 1, 2009. This new guidance was applied to business combinations completed in 2009, but had an immaterial impact on our consolidated financial statements.
Consolidation: The FASB issued accounting and presentation requirements for noncontrolling interests, which took effect on January 1, 2009, however this new guidance had an immaterial impact on our consolidated financial statements.
63
UNITED PARCEL SERVICE, INC. AND SUBSIDIARIES
NOTES TO CONSOLIDATED FINANCIAL STATEMENTS—(Continued)
Accounting Standards Issued But Not Yet Effective
Accounting pronouncements issued, but not effective until after December 31, 2010, are not expected to have a significant effect on our consolidated financial position or results or operations.
Changes in Presentation
Certain prior year amounts have been reclassified to conform to the current year presentation. These reclassifications had no impact on our financial position or results of operations.
NOTE 2. CASH AND INVESTMENTS
The following is a summary of marketable securities classified as available-for-sale at December 31, 2010 and 2009 (in millions):
| Cost | Unrealized Gains |
Unrealized Losses |
Estimated Fair Value |
|||||||||||||
| 2010 |
||||||||||||||||
| Current marketable securities: |
||||||||||||||||
| U.S. government and agency debt securities |
$ | 207 | $ | 1 | $ | (2 | ) | $ | 206 | |||||||
| Mortgage and asset-backed debt securities |
220 | 3 | (1 | ) | 222 | |||||||||||
| Corporate debt securities |
179 | 5 | (1 | ) | 183 | |||||||||||
| U.S. state and local municipal debt securities |
33 | — | — | 33 | ||||||||||||
| Other debt and equity securities |
62 | 5 | — | 67 | ||||||||||||
| Current marketable securities |
701 | 14 | (4 | ) | 711 | |||||||||||
| Non-current marketable securities: |
||||||||||||||||
| Mortgage and asset-backed debt securities |
79 | 2 | (2 | ) | 79 | |||||||||||
| U.S. state and local municipal debt securities |
49 | 2 | (6 | ) | 45 | |||||||||||
| Common equity securities |
20 | 14 | — | 34 | ||||||||||||
| Preferred equity securities |
16 | 1 | (3 | ) | 14 | |||||||||||
| Non-current marketable securities |
164 | 19 | (11 | ) | 172 | |||||||||||
| Total marketable securities |
$ | 865 | $ | 33 | $ | (15 | ) | $ | 883 | |||||||
64
UNITED PARCEL SERVICE, INC. AND SUBSIDIARIES
NOTES TO CONSOLIDATED FINANCIAL STATEMENTS—(Continued)
| Cost | Unrealized Gains |
Unrealized Losses |
Estimated Fair Value |
|||||||||||||
| 2009 |
||||||||||||||||
| Current marketable securities: |
||||||||||||||||
| U.S. government and agency debt securities |
$ | 126 | $ | — | $ | (1 | ) | $ | 125 | |||||||
| Mortgage and asset-backed debt securities |
158 | 2 | (1 | ) | 159 | |||||||||||
| Corporate debt securities |
213 | 6 | — | 219 | ||||||||||||
| U.S. state and local municipal debt securities |
22 | — | — | 22 | ||||||||||||
| Other debt and equity securities |
28 | 5 | — | 33 | ||||||||||||
| Current marketable securities |
547 | 13 | (2 | ) | 558 | |||||||||||
| Non-current marketable securities: |
||||||||||||||||
| Mortgage and asset-backed debt securities |
150 | — | (38 | ) | 112 | |||||||||||
| U.S. state and local municipal debt securities |
115 | — | (26 | ) | 89 | |||||||||||
| Common equity securities |
21 | 10 | — | 31 | ||||||||||||
| Preferred equity securities |
16 | — | (1 | ) | 15 | |||||||||||
| Non-current marketable securities |
302 | 10 | (65 | ) | 247 | |||||||||||
| Total marketable securities |
$ | 849 | $ | 23 | $ | (67 | ) | $ | 805 | |||||||
The gross realized gains on sales of marketable securities totaled $24, $16 and $19 million in 2010, 2009, and 2008, respectively. The gross realized losses totaled $18, $12 and $10 million in 2010, 2009 and 2008, respectively. Impairment losses recognized on marketable securities and short-term investments totaled $21, $17 and $23 million during 2010, 2009 and 2008 (discussed further below), respectively.
Auction Rate Securities
At December 31, 2010, we held $144 million in principal value of investments in auction rate securities. Some of these investments take the form of debt securities, and are structured as direct obligations of local governments or agencies (classified as “U.S. state and local municipal debt securities”). Other auction rate security investments are structured as obligations of asset-backed trusts (classified as “Mortgage and asset-backed debt securities”), generally all of which are collateralized by student loans and are guaranteed by the U.S. Government or through private insurance. The remaining auction rate securities take the form of preferred stock, and are collateralized by securities issued directly by large corporations or money market securities. Substantially all of our investments in auction rate securities maintain investment-grade ratings of BBB / Baa or higher by Standard & Poor’s Rating Service (“Standard & Poor’s”) and Moody’s Investors Service (“Moody’s”), respectively.
During the first quarter of 2008, market auctions, including auctions for substantially all of our auction rate securities portfolio, began to fail due to insufficient buyers. As a result of the persistent failed auctions, and the uncertainty of when these investments could successfully be liquidated at par, we reclassified all of our investments in auction rate securities to non-current marketable securities, as noted in the table above, as of March 31, 2008. As market auctions have continued to fail, we have retained the non-current classification of these securities as of December 31, 2010. The securities for which auctions have failed will continue to accrue interest and be auctioned at each respective reset date until the auction succeeds, the issuer redeems the securities, or the securities mature. During 2010, auction rate securities with a par value of $44 million were successfully auctioned, resulting in their liquidation with no realized gain or loss.
65
UNITED PARCEL SERVICE, INC. AND SUBSIDIARIES
NOTES TO CONSOLIDATED FINANCIAL STATEMENTS—(Continued)
Historically, the par value of the auction rate securities approximated fair value due to the frequent resetting of the interest rate. While we will continue to earn interest on these investments in failed auction rate securities (often at the maximum contractual interest rate), the estimated fair value of the auction rate securities no longer approximates par value due to the lack of liquidity. We estimated the fair value of these securities after considering several factors, including the credit quality of the securities, the rate of interest received since the failed auctions began, the yields of securities similar to the underlying auction rate securities, and the input of broker-dealers in these securities. As a result, we recorded an after-tax unrealized loss of approximately $4 million on these securities as of December 31, 2010 in other comprehensive income ($6 million pre-tax), reflecting the decline in the estimated fair value of these securities.
Investment Other-Than-Temporary Impairments
During the second quarter of 2010, we recorded impairment losses on certain asset-backed auction rate securities. The impairment charge resulted from provisions that allow the issuers of the securities to subordinate our holdings to newly issued debt or to tender for the securities at less than their par value. These securities, which had a cost basis of $128 million, were written down to their fair value of $107 million as of June 30, 2010, as an other-than-temporary impairment. The $21 million total impairment charge during the second quarter was recorded as a loss in investment income (loss) on the statement of consolidated income.
During the second quarter of 2009, we recorded impairment losses on certain perpetual preferred securities, and an auction rate security collateralized by preferred securities, issued by large financial institutions. The impairment charge results from conversion offers from the issuers of these securities at prices well below the stated redemption value of the preferred shares. These securities, which had a cost basis of $42 million, were written down to their fair value of $25 million as of June 30, 2009, as an other-than-temporary impairment. The $17 million total impairment charge during the second quarter was recorded as a loss in investment income (loss) on the statement of consolidated income.
During the third quarter of 2008, we recorded impairment losses on two auction rate securities that were collateralized by preferred stock issued by the Federal National Mortgage Association (“FNMA”) and the Federal Home Loan Mortgage Corporation (“FHLMC”). The impairment resulted from actions by the U.S. Department of the Treasury and the Federal Housing Finance Agency to place FNMA and FHLMC under conservatorship. Additionally, we recorded impairment losses on a municipal auction rate security and on holdings of several medium term notes issued by Lehman Brothers Inc., which declared bankruptcy during the third quarter of 2008. We do not hold any other securities in any of these entities. The total of these credit-related impairment losses during the year was $23 million, which was recorded as a loss in investment income (loss) on the statement of consolidated income.
For the remaining auction rate securities and other debt securities, we have concluded that no additional other-than-temporary impairment losses existed as of December 31, 2010. In making this determination, we considered the financial condition and prospects of the issuer, the magnitude of the losses compared with the investments’ cost, the probability that we will be unable to collect all amounts due according to the contractual terms of the security, the credit rating of the security, and our ability and intent to hold these investments until the anticipated recovery in market value occurs.
66
UNITED PARCEL SERVICE, INC. AND SUBSIDIARIES
NOTES TO CONSOLIDATED FINANCIAL STATEMENTS—(Continued)
Unrealized Losses
The following table presents the age of gross unrealized losses and fair value by investment category for all securities in a loss position as of December 31, 2010 (in millions):
| Less Than 12 Months | 12 Months or More | Total | ||||||||||||||||||||||
| Fair Value |
Unrealized Losses |
Fair Value |
Unrealized Losses |
Fair Value |
Unrealized Losses |
|||||||||||||||||||
| U.S. government and agency debt securities |
$ | 75 | $ | (2 | ) | $ | — | $ | — | $ | 75 | $ | (2 | ) | ||||||||||
| Mortgage and asset-backed debt securities |
93 | (1 | ) | 28 | (2 | ) | 121 | (3 | ) | |||||||||||||||
| Corporate debt securities |
65 | (1 | ) | — | — | 65 | (1 | ) | ||||||||||||||||
| U.S. state and local municipal debt securities |
— | — | 21 | (6 | ) | 21 | (6 | ) | ||||||||||||||||
| Other debt securities |
3 | — | — | — | 3 | — | ||||||||||||||||||
| Total debt securities |
236 | (4 | ) | 49 | (8 | ) | 285 | (12 | ) | |||||||||||||||
| Common equity securities |
— | — | — | — | — | — | ||||||||||||||||||
| Preferred equity securities |
— | — | 6 | (3 | ) | 6 | (3 | ) | ||||||||||||||||
| $ | 236 | $ | (4 | ) | $ | 55 | $ | (11 | ) | $ | 291 | $ | (15 | ) | ||||||||||
The unrealized losses in the U.S. state and local municipal securities, preferred equity securities, and mortgage and asset-backed securities primarily relate to the auction rate securities discussed previously. The unrealized losses for the non-auction rate securities within those categories are primarily related to various fixed income securities, and are primarily due to changes in market interest rates. We have both the intent and ability to hold the securities contained in the previous table for a time necessary to recover the cost basis.
Maturity Information
The amortized cost and estimated fair value of marketable securities at December 31, 2010, by contractual maturity, are shown below (in millions). Actual maturities may differ from contractual maturities because the issuers of the securities may have the right to prepay obligations without prepayment penalties.
| Cost | Estimated Fair Value |
|||||||
| Due in one year or less |
$ | 102 | $ | 102 | ||||
| Due after one year through three years |
213 | 215 | ||||||
| Due after three years through five years |
52 | 52 | ||||||
| Due after five years |
443 | 441 | ||||||
| 810 | 810 | |||||||
| Equity securities |
55 | 73 | ||||||
| $ | 865 | $ | 883 | |||||
Restricted Cash
Restricted cash and cash equivalents relate to our self-insurance requirements. In 2008, we entered into an escrow agreement with an insurance carrier to guarantee our self-insurance obligations. This agreement requires us to provide cash collateral to the insurance carrier, which is classified as other non-current assets on our consolidated balance sheets. Additional cash collateral provided is reflected in other investing activities in the statements of consolidated cash flows. This restricted cash is invested in money market funds and similar cash equivalent type assets. As of December 31, 2010 and 2009, we had $286 million in restricted cash.
67
UNITED PARCEL SERVICE, INC. AND SUBSIDIARIES
NOTES TO CONSOLIDATED FINANCIAL STATEMENTS—(Continued)
Fair Value Measurements
Marketable securities utilizing Level 1 inputs include active exchange-traded equity securities and equity index funds, and most U.S. Government debt securities, as these securities all have quoted prices in active markets. Marketable securities utilizing Level 2 inputs include non-auction rate asset-backed securities, corporate bonds, and municipal bonds. These securities are valued using market corroborated pricing, matrix pricing, or other models that utilize observable inputs such as yield curves.
We have classified our auction rate securities portfolio as utilizing Level 3 inputs, as their valuation requires substantial judgment and estimation of factors that are not currently observable in the market due to the lack of trading in the securities. The valuation may be revised in future periods as market conditions evolve. These securities were valued as of December 31, 2010 considering several factors, including the credit quality of the securities, the rate of interest received since the failed auctions began, the yields of securities similar to the underlying auction rate securities, and the input of broker-dealers in these securities.
We maintain holdings in certain investment partnerships that are measured at fair value utilizing Level 3 inputs (classified as “other investments” in the tables below, and as “Other Non-Current Assets” in the consolidated balance sheets). These partnership holdings do not have any quoted prices, nor can they be valued using inputs based on observable market data. These investments are valued internally using a discounted cash flow model based on each partnership’s financial statements and cash flow projections.
68
UNITED PARCEL SERVICE, INC. AND SUBSIDIARIES
NOTES TO CONSOLIDATED FINANCIAL STATEMENTS—(Continued)
The following table presents information about our investments measured at fair value on a recurring basis as of December 31, 2010 and 2009, and indicates the fair value hierarchy of the valuation techniques utilized to determine such fair value (in millions).
| Quoted Prices in Active Markets for Identical Assets (Level 1) |
Significant Other Observable Inputs (Level 2) |
Significant Unobservable Inputs (Level 3) |
Balance as of December 31, 2010 |
|||||||||||||
| 2010 |
||||||||||||||||
| Marketable Securities: |
||||||||||||||||
| U.S. Government and Agency Debt Securities |
$ | 206 | $ | — | $ | — | $ | 206 | ||||||||
| Mortgage and Asset-Backed Debt Securities |
— | 222 | 79 | 301 | ||||||||||||
| Corporate Debt Securities |
— | 183 | — | 183 | ||||||||||||
| U.S. State and Local Municipal Debt Securities |
— | 33 | 45 | 78 | ||||||||||||
| Other Debt and Equity Securities |
41 | 60 | 14 | 115 | ||||||||||||
| Total Marketable Securities |
247 | 498 | 138 | 883 | ||||||||||||
| Other investments |
— | — | 267 | 267 | ||||||||||||
| Total |
$ | 247 | $ | 498 | $ | 405 | $ | 1,150 | ||||||||
| Quoted Prices in Active Markets for Identical Assets (Level 1) |
Significant Other Observable Inputs (Level 2) |
Significant Unobservable Inputs (Level 3) |
Balance as of December 31, 2009 |
|||||||||||||
| 2009 |
||||||||||||||||
| Marketable Securities: |
||||||||||||||||
| U.S. Government and Agency Debt Securities |
$ | 125 | $ | — | $ | — | $ | 125 | ||||||||
| Mortgage and Asset-Backed Debt Securities |
— | 159 | 112 | 271 | ||||||||||||
| Corporate Debt Securities |
— | 219 | — | 219 | ||||||||||||
| U.S. State and Local Municipal Debt Securities |
— | 22 | 89 | 111 | ||||||||||||
| Other Debt and Equity Securities |
54 | 10 | 15 | 79 | ||||||||||||
| Total Marketable Securities |
179 | 410 | 216 | 805 | ||||||||||||
| Other investments |
— | — | 301 | 301 | ||||||||||||
| Total |
$ | 179 | $ | 410 | $ | 517 | $ | 1,106 | ||||||||
69
UNITED PARCEL SERVICE, INC. AND SUBSIDIARIES
NOTES TO CONSOLIDATED FINANCIAL STATEMENTS—(Continued)
The following table presents the changes in the above Level 3 instruments measured on a recurring basis for the year ended December 31, 2010 (in millions).
| Marketable Securities |
Other Investments |
Total | ||||||||||
| Balance on January 1, 2010 |
$ | 216 | $ | 301 | $ | 517 | ||||||
| Transfers into (out of) Level 3 |
— | — | — | |||||||||
| Net realized and unrealized gains (losses): |
||||||||||||
| Included in earnings (in investment income) |
(27 | ) | (34 | ) | (61 | ) | ||||||
| Included in accumulated other comprehensive income (pre-tax) |
59 | — | 59 | |||||||||
| Purchases |
— | — | — | |||||||||
| Settlements |
(110 | ) | — | (110 | ) | |||||||
| Balance on December 31, 2010 |
$ | 138 | $ | 267 | $ | 405 | ||||||
NOTE 3. FINANCE RECEIVABLES
The following is a summary of finance receivables at December 31, 2010 and 2009 (in millions):
| 2010 | 2009 | |||||||
| Commercial term loans |
$ | 266 | $ | 305 | ||||
| Other financing receivables |
245 | 350 | ||||||
| Gross finance receivables |
511 | 655 | ||||||
| Less: Allowance for credit losses |
(20 | ) | (31 | ) | ||||
| Balance at December 31 |
$ | 491 | $ | 624 | ||||
Our finance receivables portfolio consists of two product groups: commercial term loans and other financing receivables. Other financing receivables consist of investments in finance leases, asset-based lending, and receivable factoring. Outstanding receivable balances at December 31, 2010 and 2009 are net of unearned income of $15 and $19 million, respectively. When we “factor” (i.e., purchase) a customer invoice from a client, we record the customer receivable as an asset and also establish a liability for the funds due to the client, which is recorded in accounts payable on the consolidated balance sheet. As of December 31, 2010 and 2009, the amounts due to clients under our factoring programs were $71 and $88 million, respectively.
The following is a rollforward of the allowance for credit losses on finance receivables (in millions):
| 2010 | 2009 | |||||||
| Balance at January 1 |
$ | 31 | $ | 25 | ||||
| Provisions charged to operations |
10 | 25 | ||||||
| Charge-offs, net of recoveries |
(21 | ) | (19 | ) | ||||
| Balance at December 31 |
$ | 20 | $ | 31 | ||||
We use a multiple tier risk assessment matrix to grade and monitor asset quality. The primary assessments are made to determine the degree of risk that an obligor may default in principal or interest payments and the potential range of loss in the event of default. The risk assessment categories are:
| • | U.S. Government Guaranteed—Payments are guaranteed by the Small Business Administration or U.S. Department of Agriculture, and no loss is likely. |
70
UNITED PARCEL SERVICE, INC. AND SUBSIDIARIES
NOTES TO CONSOLIDATED FINANCIAL STATEMENTS—(Continued)
| • | Acceptable Risk—Payments are current, and no loss is likely. |
| • | Sub-Standard Risk—In default or high probability of default, but loss is unlikely. |
| • | Classified—In default, loss is probable, specific allowance for loss is assigned. |
The following is an allocation of the finance receivables portfolio by risk rating category as of December 31, 2010 (in millions):
| Commercial Lending |
Other Financing Receivables |
Total | ||||||||||
| U.S. Government guaranteed |
$ | 98 | $ | — | $ | 98 | ||||||
| Acceptable risk |
145 | 235 | 380 | |||||||||
| Sub-standard risk |
12 | 5 | 17 | |||||||||
| Classified |
11 | 5 | 16 | |||||||||
| $ | 266 | $ | 245 | $ | 511 | |||||||
The following is an aging analysis of our finance receivables as of December 31, 2010 (in millions):
| 30-59 Days Past Due |
60-90 Days Past Due |
Greater than 90 Days Past Due |
Current | Total Finance Receivables |
||||||||||||||||
| Commercial term loans: |
||||||||||||||||||||
| U.S. Government guaranteed |
$ | 2 | $ | 2 | $ | 63 | $ | 31 | $ | 98 | ||||||||||
| Other unguaranteed |
— | 8 | 15 | 145 | 168 | |||||||||||||||
| Other financing receivables |
2 | 1 | 2 | 240 | 245 | |||||||||||||||
| Total finance receivables |
$ | 4 | $ | 11 | $ | 80 | $ | 416 | $ | 511 | ||||||||||
The following is an analysis of impaired finance receivables as of December 31, 2010 (in millions):
| Recorded Investment |
Unpaid Principal Balance |
Related Allowance |
Average Recorded Investment |
Interest Income Recognized |
||||||||||||||||
| Impaired loans with related allowance |
$ | 16 | $ | 30 | $ | 8 | $ | 17 | $ | 1 | ||||||||||
| Impaired loans with no related allowance |
11 | 41 | — | 12 | — | |||||||||||||||
| Impaired loans with U.S. government guarantee |
73 | 73 | — | 80 | 2 | |||||||||||||||
| Total impaired loans |
$ | 100 | $ | 144 | $ | 8 | $ | 109 | $ | 3 | ||||||||||
The carrying value of finance receivables at December 31, 2010, by contractual maturity, is shown below (in millions). Actual maturities may differ from contractual maturities because some borrowers have the right to prepay these receivables without prepayment penalties.
| Carrying Value |
||||
| Due in one year or less |
$ | 208 | ||
| Due after one year through three years |
41 | |||
| Due after three years through five years |
24 | |||
| Due after five years |
238 | |||
| $ | 511 | |||
71
UNITED PARCEL SERVICE, INC. AND SUBSIDIARIES
NOTES TO CONSOLIDATED FINANCIAL STATEMENTS—(Continued)
Based on interest rates for financial instruments with similar terms and maturities, the estimated fair value of finance receivables is approximately $491 and $623 million as of December 31, 2010 and 2009, respectively. At December 31, 2010, we had unfunded loan commitments totaling $602 million, consisting of standby letters of credit of $93 million and other unfunded lending commitments of $509 million.
During 2009, impaired finance receivables with a carrying amount of $13 million were written down to a net fair value of $8 million, based on the fair value for the related collateral which was determined using unobservable inputs (Level 3).
NOTE 4. PROPERTY, PLANT AND EQUIPMENT
Property, plant and equipment as of December 31 consists of the following (in millions):
| 2010 | 2009 | |||||||
| Vehicles |
$ | 5,519 | $ | 5,480 | ||||
| Aircraft (including aircraft under capitalized leases) |
14,063 | 13,777 | ||||||
| Land |
1,081 | 1,079 | ||||||
| Buildings |
3,102 | 3,076 | ||||||
| Building and leasehold improvements |
2,860 | 2,800 | ||||||
| Plant equipment |
6,656 | 6,371 | ||||||
| Technology equipment |
1,552 | 1,591 | ||||||
| Equipment under operating leases |
122 | 145 | ||||||
| Construction-in-progress |
265 | 488 | ||||||
| 35,220 | 34,807 | |||||||
| Less: Accumulated depreciation and amortization |
(17,833 | ) | (16,828 | ) | ||||
| $ | 17,387 | $ | 17,979 | |||||
We continually monitor our aircraft fleet utilization in light of current and projected volume levels, aircraft fuel prices, and other factors. In 2008, we announced that we were in negotiations with DHL to provide air transportation services for all of DHL’s express, deferred and international package volume within the United States, as well as air transportation services between the United States, Canada and Mexico. In early April 2009, UPS and DHL mutually agreed to terminate further discussions on providing these services. Additionally, our U.S. Domestic Package air delivery volume had declined for several quarters as a result of persistent economic weakness and shifts in product mix from our premium air services to our lower cost ground services. As a result of these factors, the utilization of certain aircraft fleet types had declined and was expected to be lower in the future.
Based on the factors noted above, as well as FAA aging aircraft directives that would require significant future maintenance expenditures, we determined that a triggering event had occurred that required an impairment assessment of our McDonnell-Douglas DC-8-71 and DC-8-73 aircraft fleets. We conducted an impairment analysis as of March 31, 2009, and determined that the carrying amount of these fleets was not recoverable due to the accelerated expected retirement dates of the aircraft. Based on anticipated residual values for the airframes, engines, and parts, we recognized an impairment charge of $181 million in the first quarter of 2009. This charge is included in the caption “Other expenses” in the statement of consolidated income, and impacted our U.S. Domestic Package segment. The DC-8 fleets were subsequently retired from service. We currently continue to utilize and operate all of our other aircraft fleets.
The impaired airframes, engines, and parts had a net carrying value of $192 million, and were written down to an aggregate fair value of $11 million. The fair values for the impaired airframes, engines, and parts were determined using unobservable inputs (Level 3).
72
UNITED PARCEL SERVICE, INC. AND SUBSIDIARIES
NOTES TO CONSOLIDATED FINANCIAL STATEMENTS—(Continued)
NOTE 5. EMPLOYEE BENEFIT PLANS
We sponsor various retirement and pension plans, including defined benefit and defined contribution plans which cover our employees worldwide.
U.S. Pension Benefits
In the U.S. we maintain the following single-employer defined benefit pension plans: UPS Retirement Plan, UPS Pension Plan, UPS IBT Pension Plan, and the UPS Excess Coordinating Benefit Plan, a non-qualified plan.
The UPS Retirement Plan is noncontributory and includes substantially all eligible employees of participating domestic subsidiaries who are not members of a collective bargaining unit, as well as certain employees covered by a collective bargaining agreement. This plan generally provides for retirement benefits based on average compensation levels earned by employees prior to retirement. Benefits payable under this plan are subject to maximum compensation limits and the annual benefit limits for a tax qualified defined benefit plan as prescribed by the Internal Revenue Service.
The UPS Excess Coordinating Benefit Plan is a non-qualified plan that provides benefits to certain participants in the UPS Retirement Plan for amounts that exceed the benefit limits described above.
The UPS Pension Plan is noncontributory and includes certain eligible employees of participating domestic subsidiaries and members of collective bargaining units that elect to participate in the plan. This plan generally provides for retirement benefits based on service credits earned by employees prior to retirement.
The UPS IBT Pension Plan is noncontributory and includes employees that were previously members of the Central States, Southeast and Southwest Areas Pension Fund (“Central States Pension Fund”), a multi-employer pension plan, in addition to other eligible employees who are covered under certain collective bargaining agreements.
Our national master agreement with the International Brotherhood of Teamsters (“Teamsters”) allowed us, upon ratification, to withdraw employees from the Central States Pension Fund and establish this jointly trusteed single-employer plan for this group of employees. We recorded a pre-tax charge of $6.1 billion to establish our withdrawal liability upon ratification of the national master agreement, and made a $6.1 billion payment to the Central States Pension Fund in December 2007. In connection with the national master agreement and upon establishment of the UPS IBT Pension Plan, we restored certain benefit levels to our employee group within the new plan, which resulted in the initial recognition of a $1.701 billion pension liability and a corresponding $1.062 billion reduction of AOCI and $639 million reduction of deferred tax liabilities.
The withdrawal liability was based on computations performed by independent actuaries employed by the Central States Pension Fund, in accordance with the plan document and the applicable requirements of the Employee Retirement Income Security Act of 1974 (“ERISA”). We negotiated our withdrawal from the Central States Pension Fund as part of our national master agreement with the Teamsters, which included other modifications to hourly wage rates, healthcare and pension benefits, and work rules. We sought to negotiate our withdrawal from the Central States Pension Fund, as we believed the fund would likely continue to have funding challenges, and would present a risk to UPS of having to face higher future contribution requirements and a risk to the security of the pension benefits of those UPS employees who participated in the fund. We believe that we benefited financially from the ability to achieve a ratified national master agreement seven months before the expiration of the previous agreement, as well as by gaining better control over the future cost and funding of pension benefits by limiting our obligations solely to UPS Teamster employees through the new UPS IBT Pension Plan. As the UPS IBT Pension Plan matures, we believe that it will become cost beneficial from a cash flow and earnings standpoint compared with having remained in the Central States Pension Fund.
73
UNITED PARCEL SERVICE, INC. AND SUBSIDIARIES
NOTES TO CONSOLIDATED FINANCIAL STATEMENTS—(Continued)
U.S. Postretirement Medical Benefits
We also sponsor postretirement medical plans in the U.S. that provide health care benefits to our retirees who meet certain eligibility requirements and who are not otherwise covered by multi-employer plans. Generally, this includes employees with at least 10 years of service who have reached age 55 and employees who are eligible for postretirement medical benefits from a Company-sponsored plan pursuant to collective bargaining agreements. We have the right to modify or terminate certain of these plans. These benefits have been provided to certain retirees on a noncontributory basis; however, in many cases, retirees are required to contribute all or a portion of the total cost of the coverage.
International Pension Benefits
We also sponsor various defined benefit plans covering certain of our international employees. The majority of our international obligations are for defined benefit plans in Canada and the United Kingdom. In addition, many of our international employees are covered by government-sponsored retirement and pension plans. We are not directly responsible for providing benefits to participants of government-sponsored plans.
Multi-Employer Benefit Plans
We also contribute to several multi-employer pension plans for which the subsequent disclosure information is not determinable. Amounts charged to operations for pension contributions to these multi-employer plans were $1.186, $1.125 and $1.069 billion during 2010, 2009, and 2008, respectively.
We also contribute to several multi-employer health and welfare plans that cover both active and retired employees for which the subsequent disclosure information is not determinable. Amounts charged to operations for contributions to multi-employer health and welfare plans were $1.066 billion, $1.031 billion and $990 million during 2010, 2009, and 2008, respectively.
Defined Contribution Plans
We also sponsor several defined contribution plans for all employees not covered under collective bargaining agreements, and for certain employees covered under collective bargaining agreements. The Company matches, in shares of UPS common stock or cash, a portion of the participating employees’ contributions. In early 2009, we suspended the company matching contributions to the primary employee defined contribution plan. A revised program of company matching contributions was reinstated effective January 1, 2011. Matching contributions charged to expense were $4, $21, and $116 million for 2010, 2009 and 2008, respectively. The reinstatement of matching contributions is expected to increase annual expense by approximately $75 million beginning in 2011.
Contributions are also made to defined contribution money purchase plans under certain collective bargaining agreements. Amounts charged to expense were $78, $80 and $78 million for 2010, 2009, and 2008, respectively.
74
UNITED PARCEL SERVICE, INC. AND SUBSIDIARIES
NOTES TO CONSOLIDATED FINANCIAL STATEMENTS—(Continued)
Net Periodic Benefit Cost
Information about net periodic benefit cost for the company-sponsored pension and postretirement benefit plans is as follows (in millions):
| U.S. Pension Benefits | U.S. Postretirement Medical Benefits |
International Pension Benefits |
||||||||||||||||||||||||||||||||||
| 2010 | 2009 | 2008 | 2010 | 2009 | 2008 | 2010 | 2009 | 2008 | ||||||||||||||||||||||||||||
| Net Periodic Cost: |
||||||||||||||||||||||||||||||||||||
| Service cost |
$ | 723 | $ | 689 | $ | 707 | $ | 86 | $ | 85 | $ | 96 | $ | 24 | $ | 17 | $ | 26 | ||||||||||||||||||
| Interest cost |
1,199 | 1,130 | 1,051 | 214 | 211 | 202 | 34 | 28 | 31 | |||||||||||||||||||||||||||
| Expected return on assets |
(1,599 | ) | (1,488 | ) | (1,517 | ) | (22 | ) | (27 | ) | (49 | ) | (36 | ) | (26 | ) | (35 | ) | ||||||||||||||||||
| Amortization of: |
||||||||||||||||||||||||||||||||||||
| Transition obligation |
— | 4 | 5 | — | — | — | — | — | — | |||||||||||||||||||||||||||
| Prior service cost |
172 | 178 | 184 | 4 | 6 | (4 | ) | 1 | 1 | 1 | ||||||||||||||||||||||||||
| Actuarial (gain) loss |
78 | 46 | 8 | 16 | 14 | 20 | 3 | — | — | |||||||||||||||||||||||||||
| Other |
— | 3 | — | — | — | — | 6 | 1 | — | |||||||||||||||||||||||||||
| Net periodic benefit cost |
$ | 573 | $ | 562 | $ | 438 | $ | 298 | $ | 289 | $ | 265 | $ | 32 | $ | 21 | $ | 23 | ||||||||||||||||||
Actuarial Assumptions
The table below provides the weighted-average actuarial assumptions used to determine the net periodic benefit cost.
| U.S. Pension Benefits | U.S. Postretirement Medical Benefits |
International Pension Benefits |
||||||||||||||||||||||||||||||||||
| 2010 | 2009 | 2008 | 2010 | 2009 | 2008 | 2010 | 2009 | 2008 | ||||||||||||||||||||||||||||
| Discount rate |
6.58 | % | 6.75 | % | 6.47 | % | 6.43 | % | 6.66 | % | 6.25 | % | 5.84 | % | 6.17 | % | 5.57 | % | ||||||||||||||||||
| Rate of compensation increase |
4.50 | % | 4.50 | % | 4.50 | % | N/A | N/A | N/A | 3.62 | % | 3.65 | % | 3.64 | % | |||||||||||||||||||||
| Expected return on assets |
8.75 | % | 8.96 | % | 8.96 | % | 8.75 | % | 9.00 | % | 9.00 | % | 7.25 | % | 7.09 | % | 7.54 | % | ||||||||||||||||||
The table below provides the weighted-average actuarial assumptions used to determine the benefit obligations of our plans.
| U.S. Pension Benefits | U.S. Postretirement Medical Benefits |
International Pension Benefits |
||||||||||||||||||||||
| 2010 | 2009 | 2010 | 2009 | 2010 | 2009 | |||||||||||||||||||
| Discount rate |
5.98 | % | 6.58 | % | 5.77 | % | 6.43 | % | 5.36 | % | 5.84 | % | ||||||||||||
| Rate of compensation increase |
4.50 | % | 4.50 | % | N/A | N/A | 3.57 | % | 3.62 | % | ||||||||||||||
A discount rate is used to determine the present value of our future benefit obligations. In 2008 and prior years, the discount rate for U.S. plans was determined by matching the expected cash flows to a yield curve based on long-term, high quality fixed income debt instruments available as of the measurement date. In 2008, we reduced the population of bonds from which the yield curve was developed to better reflect bonds we would more likely consider to settle our obligations. In 2009, we further enhanced this process for plans in the U.S. by using a bond matching approach to select specific bonds that would satisfy our projected benefit payments. We believe the bond matching approach more closely reflects the process we would employ to settle our pension and postretirement benefit obligations. These modifications had an impact of increasing the pension benefits and
75
UNITED PARCEL SERVICE, INC. AND SUBSIDIARIES
NOTES TO CONSOLIDATED FINANCIAL STATEMENTS—(Continued)
postretirement medical benefits discount rate on average 31 and 51 basis points for 2009 and 25 and 17 basis points for 2008. For 2010, each basis point increase in the discount rate decreases the projected benefit obligation by approximately $32 million and $4 million for pension and postretirement medical benefits, respectively. For our international plans, the discount rate is determined by matching the expected cash flows of a sample plan of similar duration to a yield curve based on long-term, high quality fixed income debt instruments available as of the measurement date. These assumptions are updated annually.
An assumption for expected return on plan assets is used to determine a component of net periodic benefit cost for the fiscal year. This assumption for our U.S. plans was developed using a long-term projection of returns for each asset class, and taking into consideration our target asset allocation. The expected return for each asset class is a function of passive, long-term capital market assumptions and excess returns generated from active management. The capital market assumptions used are provided by independent investment advisors, while excess return assumptions are supported by historical performance, fund mandates and investment expectations. In addition, we compare the expected return on asset assumption with the average historical rate of return these plans have been able to generate.
For the UPS Retirement Plan, we use a market-related valuation method for recognizing investment gains or losses. Investment gains or losses are the difference between the expected and actual return based on the market-related value of assets. This method recognizes investment gains or losses over a five year period from the year in which they occur, which reduces year-to-year volatility in pension expense. Thus, a portion of the investment losses we incurred during 2008 will be deferred through 2012. Our expense in future periods will be impacted as gains or losses are recognized in the market-related value of assets.
For plans outside the U.S., consideration is given to local market expectations of long-term returns. Strategic asset allocations are determined by country, based on the nature of liabilities and considering the demographic composition of the plan participants.
Health care cost trends are used to project future postretirement benefits payable from our plans. For year-end 2010 U.S. plan obligations, future postretirement medical benefit costs were forecasted assuming an initial annual increase of 7.5%, decreasing to 5.0% by the year 2017 and with consistent annual increases at those ultimate levels thereafter.
Assumed health care cost trends can have a significant effect on the amounts reported for the U.S. postretirement medical plans. A one-percent change in assumed health care cost trend rates would have had the following effects on 2010 results (in millions):
| 1% Increase | 1% Decrease | |||||||
| Effect on total of service cost and interest cost |
$ | 9 | $ | (9 | ) | |||
| Effect on postretirement benefit obligation |
$ | 74 | $ | (78 | ) | |||
76
UNITED PARCEL SERVICE, INC. AND SUBSIDIARIES
NOTES TO CONSOLIDATED FINANCIAL STATEMENTS—(Continued)
Benefit Obligations and Fair Value of Plan Assets
The following table provides a reconciliation of the changes in the plans’ benefit obligations and fair value of plan assets as of the respective measurement dates in each year (in millions).
| U.S. Pension Benefits | U.S. Postretirement Medical Benefits |
International Pension Benefits |
||||||||||||||||||||||
| 2010 | 2009 | 2010 | 2009 | 2010 | 2009 | |||||||||||||||||||
| Benefit Obligations: |
||||||||||||||||||||||||
| Net benefit obligation at beginning of year |
$ | 17,763 | $ | 16,303 | $ | 3,336 | $ | 3,166 | $ | 575 | $ | 438 | ||||||||||||
| Service cost |
723 | 689 | 86 | 85 | 24 | 17 | ||||||||||||||||||
| Interest cost |
1,199 | 1,130 | 214 | 211 | 34 | 28 | ||||||||||||||||||
| Gross benefits paid |
(574 | ) | (504 | ) | (207 | ) | (202 | ) | (13 | ) | (12 | ) | ||||||||||||
| Plan participants’ contributions |
— | — | 17 | 16 | 1 | 1 | ||||||||||||||||||
| Plan amendments |
(7 | ) | 1 | 8 | (21 | ) | — | — | ||||||||||||||||
| Actuarial (gain)/loss |
2,238 | 141 | 142 | 80 | 58 | 53 | ||||||||||||||||||
| Foreign currency exchange rate changes |
— | — | — | — | (4 | ) | 49 | |||||||||||||||||
| Curtailments and settlements |
— | — | — | — | (1 | ) | (3 | ) | ||||||||||||||||
| Other |
— | 3 | 1 | 1 | 6 | 4 | ||||||||||||||||||
| Net benefit obligation at end of year |
$ | 21,342 | $ | 17,763 | $ | 3,597 | $ | 3,336 | $ | 680 | $ | 575 | ||||||||||||
| Fair Value of Plan Assets: |
||||||||||||||||||||||||
| Fair value of plan assets at beginning of year |
$ | 15,351 | $ | 12,809 | $ | 298 | $ | 349 | $ | 481 | $ | 343 | ||||||||||||
| Actual return on plan assets |
2,215 | 2,258 | 30 | 44 | 48 | 60 | ||||||||||||||||||
| Employer contributions |
3,100 | 788 | 95 | 91 | 45 | 45 | ||||||||||||||||||
| Plan participants’ contributions |
— | — | 17 | 16 | 1 | 1 | ||||||||||||||||||
| Gross benefits paid |
(574 | ) | (504 | ) | (207 | ) | (202 | ) | (13 | ) | (12 | ) | ||||||||||||
| Foreign currency exchange rate changes |
— | — | — | — | — | 44 | ||||||||||||||||||
| Curtailments and settlements |
— | — | — | — | (1 | ) | (3 | ) | ||||||||||||||||
| Other |
— | — | — | — | — | 3 | ||||||||||||||||||
| Fair value of plan assets at end of year |
$ | 20,092 | $ | 15,351 | $ | 233 | $ | 298 | $ | 561 | $ | 481 | ||||||||||||
77
UNITED PARCEL SERVICE, INC. AND SUBSIDIARIES
NOTES TO CONSOLIDATED FINANCIAL STATEMENTS—(Continued)
Funded Status
The following table discloses the funded status, as of the respective measurement dates in each year, of our plans and the amounts recognized in our balance sheet as of December 31 (in millions):
| U.S. Pension Benefits | U.S. Postretirement Medical Benefits |
International Pension Benefits |
||||||||||||||||||||||
| 2010 | 2009 | 2010 | 2009 | 2010 | 2009 | |||||||||||||||||||
| Funded Status: |
||||||||||||||||||||||||
| Fair value of plan assets |
$ | 20,092 | $ | 15,351 | $ | 233 | $ | 298 | $ | 561 | $ | 481 | ||||||||||||
| Benefit obligation |
(21,342 | ) | (17,763 | ) | (3,597 | ) | (3,336 | ) | (680 | ) | (575 | ) | ||||||||||||
| Funded status recognized at December 31 |
$ | (1,250 | ) | $ | (2,412 | ) | $ | (3,364 | ) | $ | (3,038 | ) | $ | (119 | ) | $ | (94 | ) | ||||||
| Funded Status Amounts Recognized in our Balance Sheet: |
||||||||||||||||||||||||
| Other non-current assets |
$ | 42 | $ | — | $ | — | $ | — | $ | 1 | $ | 15 | ||||||||||||
| Other current liabilities |
(11 | ) | (11 | ) | (99 | ) | (87 | ) | (3 | ) | (4 | ) | ||||||||||||
| Pension and postretirement benefit obligations |
(1,281 | ) | (2,401 | ) | (3,265 | ) | (2,951 | ) | (117 | ) | (105 | ) | ||||||||||||
| Net asset (liability) at December 31 |
$ | (1,250 | ) | $ | (2,412 | ) | $ | (3,364 | ) | $ | (3,038 | ) | $ | (119 | ) | $ | (94 | ) | ||||||
| Amounts Recognized in AOCI: |
||||||||||||||||||||||||
| Unrecognized net prior service cost |
$ | (1,660 | ) | $ | (1,839 | ) | $ | (113 | ) | $ | (109 | ) | $ | (8 | ) | $ | (9 | ) | ||||||
| Unrecognized net actuarial loss |
(6,833 | ) | (5,289 | ) | (702 | ) | (584 | ) | (114 | ) | (70 | ) | ||||||||||||
| Gross unrecognized cost at December 31 |
(8,493 | ) | (7,128 | ) | (815 | ) | (693 | ) | (122 | ) | (79 | ) | ||||||||||||
| Deferred tax asset at December 31 |
3,193 | 2,680 | 306 | 261 | 31 | 22 | ||||||||||||||||||
| Net unrecognized cost at December 31 |
$ | (5,300 | ) | $ | (4,448 | ) | $ | (509 | ) | $ | (432 | ) | $ | (91 | ) | $ | (57 | ) | ||||||
The accumulated benefit obligation for our pension plans as of the measurement dates in 2010 and 2009 was $20.241 and $16.968 billion, respectively.
Benefit payments under the pension plans include $14 and $15 million paid from employer assets in 2010 and 2009, respectively. Benefit payments (net of participant contributions) under the postretirement medical benefit plans include $94 and $90 million paid from employer assets in 2010 and 2009, respectively. Such benefit payments from employer assets are also categorized as employer contributions.
At December 31, 2010 and 2009, the projected benefit obligation, the accumulated benefit obligation, and the fair value of plan assets for pension plans with an accumulated benefit obligation in excess of plan assets were as follows (in millions):
| Project Benefit Obligation Exceeds the Fair Value of Plan Assets |
Accumulated Benefit Obligation Exceeds the Fair Value of Plan Assets |
|||||||||||||||
| 2010 | 2009 | 2010 | 2009 | |||||||||||||
| U.S. Pension Benefits |
||||||||||||||||
| Projected benefit obligation |
$ | 3,227 | $ | 17,763 | $ | 3,227 | $ | 4,995 | ||||||||
| Accumulated benefit obligation |
3,195 | 4,963 | 3,195 | 4,963 | ||||||||||||
| Fair value of plan assets |
1,934 | 15,351 | 1,934 | 2,962 | ||||||||||||
| International Pension Benefits |
||||||||||||||||
| Projected benefit obligation |
$ | 662 | $ | 346 | $ | 362 | $ | 82 | ||||||||
| Accumulated benefit obligation |
323 | 69 | 323 | 69 | ||||||||||||
| Fair value of plan assets |
543 | 237 | 257 | 18 | ||||||||||||
78
UNITED PARCEL SERVICE, INC. AND SUBSIDIARIES
NOTES TO CONSOLIDATED FINANCIAL STATEMENTS—(Continued)
The decrease in U.S. pension benefits amounts where the projected benefit obligation exceeds the fair value of plan assets is due to the funded status for both the UPS Retirement Plan and UPS Pension Plan changing from liabilities at December 31, 2009 to assets at December 31, 2010.
The accumulated postretirement benefit obligation exceeds plan assets for all of our U.S. postretirement medical benefit plans.
Accumulated Other Comprehensive Income
The amounts in AOCI expected to be amortized and recognized as a component of net periodic benefit cost in 2011 are as follows (in millions):
| U.S. Pension Benefits | U.S. Postretirement Medical Benefits |
International Pension Benefits |
||||||||||
| Prior service cost / (benefit) |
$ | 170 | $ | 7 | $ | 1 | ||||||
| Actuarial loss |
283 | 21 | 4 | |||||||||
| $ | 453 | $ | 28 | $ | 5 | |||||||
For all of our benefit plans, we utilize a corridor approach for determining the amount of unrecognized net gain or loss that will be required to be amortized in the following year. The corridor is equal to 10% of the greater of the projected benefit obligation or the market-related value of plan assets as of the beginning of the year.
Pension and Postretirement Plan Assets
The applicable benefit plan committees establish investment guidelines and strategies, and regularly monitor the performance of the funds and portfolio managers. Our investment guidelines address the following items: governance, general investment beliefs and principles, investment objectives, specific investment goals, process for determining/maintaining the asset allocation policy, long-term asset allocation, rebalancing, investment restrictions/prohibited transactions, portfolio manager structure and diversification (which addresses limits on the amount of investments held by any one manager to minimize risk), portfolio manager selection criteria, plan evaluation, portfolio manager performance review and evaluation and risk management (including various measures used to evaluate risk tolerance).
Our investment strategy with respect to pension assets is to invest the assets in accordance with applicable laws and regulations. The long-term primary objectives for our pension assets are to: (1) provide for a reasonable amount of long-term growth of capital, with prudent exposure to risk; and protect the assets from erosion of purchasing power; (2) provide investment results that meet or exceed the plans’ expected long-term rate of return; and (3) match the duration of the liabilities and assets of the plans to reduce the potential risk of large employer contributions being necessary in the future. The plans strive to meet these objectives by employing portfolio managers to actively manage assets within the guidelines and strategies set forth by the benefit plan committees. These managers are evaluated by comparing their performance to applicable benchmarks.
79
UNITED PARCEL SERVICE, INC. AND SUBSIDIARIES
NOTES TO CONSOLIDATED FINANCIAL STATEMENTS—(Continued)
The fair values of U.S. pension and postretirement benefit plan assets by asset category as of December 31, 2010 are presented below (in millions), as well as the percentage that each category comprises of our total plan assets and the respective target allocations.
| Level 1 | Level 2 | Level 3 | Total Assets |
Percentage of Plan Assets - 2010 |
Percentage of Plan Assets - 2009 |
Target Allocation 2010 |
||||||||||||||||||||||
| Asset Category: |
||||||||||||||||||||||||||||
| Cash and cash equivalents |
$ | — | $ | 579 | $ | — | $ | 579 | 2.9 | % | 1.9 | % | 0-5 | % | ||||||||||||||
| Equity Securities: |
||||||||||||||||||||||||||||
| U.S. Large Cap |
4,897 | — | — | 4,897 | ||||||||||||||||||||||||
| U.S. Small Cap |
874 | — | — | 874 | ||||||||||||||||||||||||
| International Core |
1,219 | 920 | — | 2,139 | ||||||||||||||||||||||||
| Emerging Markets |
528 | 281 | — | 809 | ||||||||||||||||||||||||
| International Small Cap |
117 | 196 | — | 313 | ||||||||||||||||||||||||
| Total Equity Securities |
7,635 | 1,397 | — | 9,032 | 44.4 | 54.1 | 40-60 | |||||||||||||||||||||
| Fixed Income Securities: |
||||||||||||||||||||||||||||
| U.S. Government Securities |
3,502 | 313 | — | 3,815 | ||||||||||||||||||||||||
| Corporate Bonds |
608 | 1,694 | 193 | 2,495 | ||||||||||||||||||||||||
| Mortgage-Backed Securities |
— | 50 | — | 50 | ||||||||||||||||||||||||
| Total Fixed Income Securities |
4,110 | 2,057 | 193 | 6,360 | 31.3 | 23.8 | 20-40 | |||||||||||||||||||||
| Other Investments: |
||||||||||||||||||||||||||||
| Hedge Funds |
— | — | 2,023 | 2,023 | 10.0 | 8.2 | 5-15 | |||||||||||||||||||||
| Real Estate |
98 | 135 | 789 | 1,022 | 5.0 | 4.7 | 1-10 | |||||||||||||||||||||
| Private Equity |
— | — | 1,309 | 1,309 | 6.4 | 7.3 | 1-10 | |||||||||||||||||||||
| Total U.S. Plan Assets |
$ | 11,843 | $ | 4,168 | $ | 4,314 | $ | 20,325 | 100.0 | % | 100.0 | % | 100 | % | ||||||||||||||
Equity securities include UPS class A shares of common stock in the amounts of $346 million (1.7% of total plan assets) and $351 million (2.2% of total plan assets), as of December 31, 2010 and December 31, 2009, respectively.
Pension assets utilizing Level 1 inputs include fair values of equity investments, corporate debt instruments, and U.S. government securities that were determined by closing prices for those securities traded on national stock exchanges, while securities traded in the over-the-counter market and listed securities for which no sale was reported on the valuation date are valued at the mean between the last reported bid and asked prices.
Level 2 assets include certain bonds that are valued based on yields currently available on comparable securities of other issues with similar credit ratings, mortgage-backed securities that are valued based on cash flow and yield models using acceptable modeling and pricing conventions, and certain investments that are pooled with other investments held by the trustee in a commingled employee benefit trust fund. The investments in the commingled funds are valued by taking the percentage owned by the respective plan in the underlying net asset value of the trust fund, which was determined in accordance with the paragraph above.
Certain investments’ estimated fair value is based on unobservable inputs that are not corroborated by observable market data and are thus classified as Level 3. These investments include commingled funds
80
UNITED PARCEL SERVICE, INC. AND SUBSIDIARIES
NOTES TO CONSOLIDATED FINANCIAL STATEMENTS—(Continued)
comprised of corporate and government bonds, hedge funds, real estate investments and private equity funds. The commingled funds are valued using net asset values, adjusted, as appropriate, for investment fund specific inputs determined to be significant to the valuation. Investments in hedge funds are valued using reported net asset values as of December 31. These assets are primarily invested in a portfolio of diversified, direct investments and funds of hedge funds. Real estate investments and private equity funds are valued using fair values per the most recent partnership audited financial reports, adjusted as appropriate for any lag between the date of the financial reports and December 31. The real estate investments consist of U.S. and non-U.S. real estate investments and are broadly diversified. The fair values may, due to the inherent uncertainty of valuation for those alternative investments, differ significantly from the values that would have been used had a ready market for the alternative investments existed, and the differences could be material.
At December 31, 2010 approximately $3.766 billion of the plan assets are held in comingled stock funds that each hold U.S. and international public market securities. The plan held the right to liquidate its positions in these commingled stock funds at any time, subject only to a brief notification period. No unfunded commitment existed with respect to these commingled stock funds at December 31, 2010.
The plan holds approximately $2.098 billion of its investments in limited partnership interests in various private equity and real estate funds. Limited provision exists for the redemption of these interests by the general partners that invest these funds until the end of the term of the partnerships, typically ranging between 12 and 18 years from the date of inception. An active secondary market exists for similar partnership interests, although no particular value (discount or premium) can be guaranteed. At December 31, 2010, unfunded commitments to such limited partnerships totaling approximately $585 million are expected to be contributed over the remaining investment period, typically ranging between three and six years.
Approximately $2.023 billion of the plan investments are held in hedge funds that pursue multiple strategies to diversify risk and reduce volatility. Most of these funds require two to three months notice for redemptions and allow them to occur either quarterly or semi-annually, while others allow for redemption after only a brief notification period with no restriction on redemption frequency. No unfunded commitments existed with respect to these hedge funds.
The fair value measurement of plan assets using significant unobservable inputs (Level 3) changed during 2010 due to the following (in millions):
| Corporate Bonds |
Hedge Funds |
Real Estate |
Private Equity |
Total | ||||||||||||||||
| Balance on January 1, 2010 |
$ | 201 | $ | 1,284 | $ | 550 | $ | 1,145 | $ | 3,180 | ||||||||||
| Actual Return on Assets: |
||||||||||||||||||||
| Assets Held at End of Year |
(5 | ) | 129 | 100 | 177 | 401 | ||||||||||||||
| Assets Sold During the Year |
13 | 10 | — | 1 | 24 | |||||||||||||||
| Purchases |
41 | 711 | 152 | 149 | 1,053 | |||||||||||||||
| Sales |
(57 | ) | (111 | ) | (13 | ) | (163 | ) | (344 | ) | ||||||||||
| Settlements |
— | — | — | — | — | |||||||||||||||
| Transfers Into (Out of) Level 3 |
— | — | — | — | — | |||||||||||||||
| Balance on December 31, 2010 |
$ | 193 | $ | 2,023 | $ | 789 | $ | 1,309 | $ | 4,314 | ||||||||||
The fair value disclosures above have not been provided for our international pension benefits plans since asset allocations are determined and managed at the individual country level. However, in general, the asset allocations for these plans (approximately 65% equity securities, 30% debt securities and 5% cash) are similar to
81
UNITED PARCEL SERVICE, INC. AND SUBSIDIARIES
NOTES TO CONSOLIDATED FINANCIAL STATEMENTS—(Continued)
our U.S. plans. The amount of assets having significant unobservable inputs (Level 3), if any, in these plans would be immaterial to our financial statements.
Expected Cash Flows
Information about expected cash flows for the pension and postretirement benefit plans is as follows (in millions):
| U.S. Pension Benefits |
U.S. Postretirement Medical Benefits |
International Pension Benefits |
||||||||||
| Employer Contributions: |
||||||||||||
| 2011 (expected) to plan trusts |
$ | 1,200 | $ | — | $ | 41 | ||||||
| 2011 (expected) to plan participants |
12 | 102 | 2 | |||||||||
| Expected Benefit Payments: |
||||||||||||
| 2011 |
$ | 611 | $ | 213 | $ | 14 | ||||||
| 2012 |
690 | 226 | 16 | |||||||||
| 2013 |
772 | 246 | 17 | |||||||||
| 2014 |
862 | 228 | 18 | |||||||||
| 2015 |
958 | 244 | 21 | |||||||||
| 2016 - 2020 |
6,483 | 1,436 | 142 | |||||||||
Our funding policy for U.S. plans is to contribute amounts annually that are at least equal to the amounts required by applicable laws and regulations, or to directly fund payments to plan participants, as applicable. International plans will be funded in accordance with local regulations. The 2011 (expected) to plan trusts contribution of $1.2 billion for U.S. pension benefits was made in January 2011. Additional discretionary contributions may be made when deemed appropriate to meet the long-term obligations of the plans. Expected benefit payments for pensions will be primarily paid from plan trusts. Expected benefit payments for postretirement medical benefits will be paid from plan trusts and corporate assets.
NOTE 6. BUSINESS ACQUISITIONS, GOODWILL AND INTANGIBLE ASSETS
The following table indicates the allocation of goodwill by reportable segment (in millions):
| U.S. Domestic Package |
International Package |
Supply Chain & Freight |
Consolidated | |||||||||||||
| December 31, 2008 balance |
$ | — | $ | 288 | $ | 1,698 | $ | 1,986 | ||||||||
| Acquired |
— | 82 | — | 82 | ||||||||||||
| Disposals |
— | — | (6 | ) | (6 | ) | ||||||||||
| Currency / Other |
— | 4 | 23 | 27 | ||||||||||||
| December 31, 2009 balance |
$ | — | $ | 374 | $ | 1,715 | $ | 2,089 | ||||||||
| Acquired |
— | — | — | — | ||||||||||||
| Purchase Accounting Adjustments |
— | 5 | (2 | ) | 3 | |||||||||||
| Currency / Other |
— | (2 | ) | (9 | ) | (11 | ) | |||||||||
| December 31, 2010 balance |
$ | — | $ | 377 | $ | 1,704 | $ | 2,081 | ||||||||
Business Acquisitions
The increase to goodwill in the International Package segment during 2010 was due to adjustments to the purchase price allocation for Unsped Paket Servisi San ve Ticaret A.S. (“Unsped”), which was acquired in
82
UNITED PARCEL SERVICE, INC. AND SUBSIDIARIES
NOTES TO CONSOLIDATED FINANCIAL STATEMENTS—(Continued)
August 2009. This was offset by the decrease in the International Package and Supply Chain & Freight segments due to the impact of the strengthening U.S. Dollar on the translation of non-U.S. Dollar goodwill balances.
The goodwill acquired in the International Package segment in 2009 was primarily due to the acquisition of Unsped, as discussed further below. We also acquired an agent in Slovenia during the second quarter of 2009. The increase in goodwill in the Supply Chain & Freight segment was due to the impact of fluctuations in the U.S. Dollar with other currencies on the translation of non-U.S. Dollar goodwill balances, partially offset by the allocation of goodwill to the sale of certain non-U.S. Mail Boxes Etc. franchise relationships.
In August 2009, we completed the formation of a new joint venture headquartered in Dubai to develop and grow UPS express package, freight forwarding and contract logistics services across the Middle East, Turkey and portions of Central Asia. We own 80% of this joint venture, and we consolidate the financial statements of the joint venture. In conjunction with the formation of this joint venture, the joint venture acquired the small package operations of Unsped, our existing service agent in Turkey. We contributed certain existing UPS operations in the region to the new joint venture, along with cash consideration of $40 million and an additional $40 million that will be due on a deferred basis. We maintain an option to purchase the remaining 20% of the joint venture, and the joint venture partner maintains a put option to require us to purchase the remaining 20% interest. Upon exercise of the call or put option, a payment of $20 million will be required. An additional payment may be due depending upon the earnings of the joint venture. The 20% portion of the joint venture that we do not own, which represents temporary equity, is recorded as a noncontrolling interest in shareowners’ equity. The express package business operations of Unsped are included in our International Package segment, while the freight forwarding business of Unsped is included in our Supply Chain & Freight segment.
Pro forma results of operations have not been presented for these acquisitions, because the effects of these transactions were not material. The results of operations of these acquired companies have been included in our statements of consolidated income from the date of acquisition.
Goodwill Impairment
We test our goodwill for impairment annually, as of October 1st, on a reporting unit basis. Our reporting units are comprised of the Europe, Asia, and Americas reporting units in the International Package reporting segment, and the Forwarding & Logistics, UPS Freight, MBE / UPS Store, and UPS Capital reporting units in the Supply Chain & Freight reporting segment. The impairment test involves a two-step process. First, a comparison of the fair value of the applicable reporting unit with the aggregate carrying values, including goodwill, is performed. We primarily determine the fair value of our reporting units using a discounted cash flow model, and supplement this with observable valuation multiples for comparable companies, as applicable. If the carrying amount of a reporting unit exceeds the reporting unit’s fair value, we perform the second step of the goodwill impairment test to determine the amount of impairment loss. The second step includes comparing the implied fair value of the affected reporting unit’s goodwill with the carrying value of that goodwill.
In the fourth quarter of 2008, we completed our annual goodwill impairment testing and determined that our UPS Freight reporting unit, which was formed through the acquisition of Overnite Corporation in 2005, had a goodwill impairment of $548 million which is included in the caption “other expenses” in the consolidated income statement. This impairment charge resulted from several factors, including a lower cash flow forecast due to a longer estimated economic recovery time for the LTL sector, and significant deterioration in equity valuations for other similar LTL industry participants. At the time of acquisition of Overnite Corporation, LTL equity valuations were higher and the economy was significantly stronger. We invested in operational improvements and technology upgrades to enhance service and performance, as well as expand service offerings. However, this process took longer than initially anticipated, and thus financial results have been below our
83
UNITED PARCEL SERVICE, INC. AND SUBSIDIARIES
NOTES TO CONSOLIDATED FINANCIAL STATEMENTS—(Continued)
expectations. Additionally, the LTL sector in 2008 was adversely impacted by the economic recession in the U.S., lower industrial production and retail sales, volatile fuel prices, and significant levels of price-based competition. By the fourth quarter of 2008, the combination of these internal and external factors reduced our near term expectations for this unit, leading to the goodwill impairment charge.
None of the other reporting units incurred an impairment of goodwill in 2008, nor did we have any goodwill impairment charges in 2010 or 2009. Cumulatively, our Supply Chain & Freight reporting segment has recorded goodwill impairment charges of $622 million, while our International and U.S. Domestic Package segments have not recorded any impairment charges.
Intangible Assets
The following is a summary of intangible assets at December 31, 2010 and 2009 (in millions):
| Gross Carrying Amount |
Accumulated Amortization |
Net Carrying Value |
Weighted- Average Amortization Period (in years) |
|||||||||||||
| December 31, 2010: |
||||||||||||||||
| Trademarks, licenses, patents, and other |
$ | 187 | $ | (50 | ) | $ | 137 | 4.8 | ||||||||
| Customer lists |
99 | (59 | ) | 40 | 9.1 | |||||||||||
| Franchise rights |
109 | (52 | ) | 57 | 20.0 | |||||||||||
| Capitalized software |
1,927 | (1,562 | ) | 365 | 3.1 | |||||||||||
| Total Intangible Assets, Net |
$ | 2,322 | $ | (1,723 | ) | $ | 599 | 4.3 | ||||||||
| December 31, 2009: |
||||||||||||||||
| Trademarks, licenses, patents, and other |
$ | 132 | $ | (9 | ) | $ | 123 | |||||||||
| Customer lists |
107 | (52 | ) | 55 | ||||||||||||
| Franchise rights |
109 | (46 | ) | 63 | ||||||||||||
| Capitalized software |
1,812 | (1,457 | ) | 355 | ||||||||||||
| Total Intangible Assets, Net |
$ | 2,160 | $ | (1,564 | ) | $ | 596 | |||||||||
All of our recorded intangible assets other than goodwill are deemed to be finite-lived intangibles, and are thus amortized over their estimated useful lives. Impairment tests for these intangible assets are only performed when a triggering event occurs that indicates that the carrying value of the intangible may not be recoverable. In 2008, as a result of weak performance in our domestic package operations in the United Kingdom, we reviewed our long-lived assets, including intangible assets, for impairment within our U.K. domestic package entity. Based on prior performance and near-term projections, the value assigned to the customer list intangible asset acquired within the U.K. domestic package business was determined to be impaired. This impairment was the result of both higher than anticipated customer turnover and reduced operating margins associated with the acquired business. Accordingly, an intangible asset impairment charge of $27 million was recorded for the year ended December 31, 2008, which is included in the caption “other expenses” in the consolidated income statement. There were no impairments of intangible assets in 2009 or 2010.
Amortization of intangible assets was $224, $185 and $202 million during 2010, 2009 and 2008, respectively. Expected amortization of finite-lived intangible assets recorded as of December 31, 2010 for the next five years is as follows (in millions): 2011—$238; 2012—$177; 2013—$106; 2014—$35; 2015—$12. Amortization expense in future periods will be affected by business acquisitions, software development, licensing agreements, sponsorships and other factors.
84
UNITED PARCEL SERVICE, INC. AND SUBSIDIARIES
NOTES TO CONSOLIDATED FINANCIAL STATEMENTS—(Continued)
NOTE 7. DEBT OBLIGATIONS AND COMMITMENTS
The carrying value of our debt obligations, as of December 31, consists of the following (in millions):
| Maturity | 2010 | 2009 | ||||||||||
| Commercial paper |
2011 | $ | 341 | $ | 672 | |||||||
| 4.50% senior notes |
2013 | 1,815 | 1,773 | |||||||||
| 3.875% senior notes |
2014 | 1,061 | 1,023 | |||||||||
| 5.50% senior notes |
2018 | 795 | 758 | |||||||||
| 5.125% senior notes |
2019 | 1,032 | 991 | |||||||||
| 8.375% debentures |
2020 | 453 | 455 | |||||||||
| 3.125% senior notes |
2021 | 1,464 | — | |||||||||
| 8.375% debentures |
2030 | 284 | 284 | |||||||||
| 6.20% senior notes |
2038 | 1,480 | 1,480 | |||||||||
| 4.875% senior notes |
2040 | 488 | — | |||||||||
| Floating rate senior notes |
2049 – 2053 | 386 | 409 | |||||||||
| Capital lease obligations |
2011 – 2021 | 160 | 369 | |||||||||
| Facility notes and bonds |
2015 – 2036 | 320 | 320 | |||||||||
| UPS Notes |
— | 175 | ||||||||||
| Pound Sterling notes |
2031 / 2050 | 764 | 791 | |||||||||
| Other debt |
2011 – 2012 | 3 | 21 | |||||||||
| Total debt |
10,846 | 9,521 | ||||||||||
| Less current maturities |
(355 | ) | (853 | ) | ||||||||
| Long-term debt |
$ | 10,491 | $ | 8,668 | ||||||||
Commercial Paper
The weighted average interest rate on the commercial paper outstanding as of December 31, 2010 and 2009 was 0.18% and 0.10%, respectively. As of December 31, 2010, the entire commercial paper balance was classified as a current liability. The amount of commercial paper outstanding in 2011 is expected to fluctuate. We are authorized to borrow up to $10.0 billion under the U.S. commercial paper program we maintain as of December 31, 2010. We also maintain a European commercial paper program under which we are authorized to borrow up to €1.0 billion in a variety of currencies, however no amounts were outstanding under this program as of December 31, 2010.
Fixed Rate Senior Notes
In January 2008, we completed an offering of $1.750 billion of 4.50% senior notes due January 2013, $750 million of 5.50% senior notes due January 2018, and $1.500 billion of 6.20% senior notes due January 2038. All of the notes pay interest semiannually, and allow for redemption of the notes by UPS at any time by paying the greater of the principal amount or a “make-whole” amount, plus accrued interest. After pricing and underwriting discounts, we received a total of $3.961 billion in cash proceeds from the offering. The proceeds from the offering were used to reduce our outstanding commercial paper balance. We subsequently entered into interest rate swaps on portions of the 2013 and 2018 notes, which effectively converted the fixed interest rates on the notes to variable LIBOR-based interest rates. The average interest rate payable on the notes, including the impact of the interest rate swaps, for 2010 and 2009, respectively, was 2.42% and 2.51% for the 2013 notes, and 2.22% and 2.16% for the 2018 notes.
85
UNITED PARCEL SERVICE, INC. AND SUBSIDIARIES
NOTES TO CONSOLIDATED FINANCIAL STATEMENTS—(Continued)
In March 2009, we completed an offering of $1.0 billion of 3.875% senior notes due April 2014 and $1.0 billion of 5.125% senior notes due April 2019. These notes pay interest semiannually, and we may redeem the notes at any time by paying the greater of the principal amount or a “make-whole” amount, plus accrued interest. After pricing and underwriting discounts, we received a total of $1.989 billion in cash proceeds from the offering. The proceeds from the offering were used for general corporate purposes, including the reduction of our outstanding commercial paper balance. We subsequently entered into interest rate swaps on the 2014 and portions of the 2019 notes, which effectively converted the fixed interest rates on the notes to variable LIBOR-based interest rates. The average interest rate payable on the notes, including the impact of the interest rate swaps, for 2010 and 2009, respectively, was 1.02% and 1.02% for the 2014 notes, and 1.69% and 1.93% for the 2019 notes.
In November 2010, we completed an offering of $1.5 billion of 3.125% senior notes due January 2021 and $500 million of 4.875% senior notes due November 2040. These notes pay interest semiannually, and we may redeem the notes at any time by paying the greater of the principal amount or a “make-whole” amount, plus accrued interest. After pricing and underwriting discounts, we received a total of $1.972 billion in cash proceeds from the offering. The proceeds from the offering were used to make contributions to our primary domestic pension plans. We subsequently entered into interest rate swaps on the 2021 notes, which effectively converted the fixed interest rates on the notes to variable LIBOR-based interest rates. The average interest rate payable on the 2021 notes, including the impact of the interest rate swaps, for 2010 was 1.76%.
8.375% Debentures
On January 22, 1998, we exchanged $276 million of an original $700 million in debentures for new debentures of equal principal with a maturity of April 1, 2030. The new debentures have the same interest rate as the 8.375% debentures due 2020 until April 1, 2020, and, thereafter, the interest rate will be 7.62% for the final 10 years. The 2030 debentures are redeemable in whole or in part at our option at any time. The redemption price is equal to the greater of 100% of the principal amount and accrued interest or the sum of the present values of the remaining scheduled payout of principal and interest thereon discounted to the date of redemption at a benchmark treasury yield plus five basis points plus accrued interest. The remaining $424 million of 2020 debentures are not subject to redemption prior to maturity. Interest is payable semiannually on the first of April and October for both debentures and neither debenture is subject to sinking fund requirements.
Floating Rate Senior Notes
The floating rate senior notes bear interest at one-month LIBOR less 45 basis points. The average interest rates for 2010 and 2009 were 0.00% and 0.01%, respectively. These notes are callable at various times after 30 years at a stated percentage of par value, and putable by the note holders at various times after 10 years at a stated percentage of par value. The notes have maturities ranging from 2049 through 2053. In 2010, we redeemed notes with a principal value of $23 million after put options were exercised by the note holders.
86
UNITED PARCEL SERVICE, INC. AND SUBSIDIARIES
NOTES TO CONSOLIDATED FINANCIAL STATEMENTS—(Continued)
Capital Lease Obligations
We have certain aircraft subject to capital leases. Some of the obligations associated with these capital leases have been legally defeased. The recorded value of aircraft subject to capital leases, which are included in Property, Plant and Equipment is as follows as of December 31 (in millions):
| 2010 | 2009 | |||||||
| Aircraft |
$ | 2,466 | $ | 2,571 | ||||
| Accumulated amortization |
(628 | ) | (565 | ) | ||||
| $ | 1,838 | $ | 2,006 | |||||
These capital lease obligations have principal payments due at various dates from 2011 through 2021.
Facility Notes and Bonds
We have entered into agreements with certain municipalities to finance the construction of, or improvements to, facilities that support our U.S. Domestic Package and Supply Chain & Freight operations in the United States. These facilities are located around airport properties in Louisville, Kentucky; Dallas, Texas; and Philadelphia, Pennsylvania. Under these arrangements, we enter into a lease or loan agreement that covers the debt service obligations on the bonds issued by the municipalities, as follows:
| • | Bonds with a principal balance of $149 million issued by the Louisville Regional Airport Authority associated with our Worldport facility in Louisville, Kentucky. The bonds, which are due in January 2029, bear interest at a variable rate, and the average interest rates for 2010 and 2009 were 0.22% and 0.31%, respectively. |
| • | Bonds with a principal balance of $43 million issued by the Louisville Regional Airport Authority associated with our air freight facility in Louisville, Kentucky. The bonds were issued in November 2006 and are due in November 2036. The bonds bear interest at a variable rate, and the average interest rates for 2010 and 2009 were 0.24% and 0.25%, respectively. |
| • | Bonds with a principal balance of $29 million issued by the Dallas / Forth Worth International Airport Facility Improvement Corporation associated with our Dallas, Texas airport facilities. The bonds are due in May 2032 and bear interest at a variable rate, however the variable cash flows on the obligation have been swapped to a fixed 5.11%. |
| • | Bonds with a principal balance of $100 million issued by the Delaware County, Pennsylvania Industrial Development Authority associated with our Philadelphia, Pennsylvania airport facilities. The bonds, which are due in December 2015, bear interest at a variable rate, and the average interest rates for 2010 and 2009 were 0.20% and 0.20%, respectively. |
In October 2009, $62 million in facility notes and bonds matured, and an additional $46 million that were originally scheduled to mature in 2018 were called for early redemption. The bonds were issued by the city of Dayton, Ohio and were associated with a Dayton airport facility.
UPS Notes
The UPS Notes program involved the periodic issuance of fixed rate notes in $1,000 increments with various terms and maturities. Some of the fixed obligations associated with the notes were previously swapped to
87
UNITED PARCEL SERVICE, INC. AND SUBSIDIARIES
NOTES TO CONSOLIDATED FINANCIAL STATEMENTS—(Continued)
floating rates, based on different LIBOR indices plus or minus a spread. The average interest rate payable on the notes, including the effect of any associated interest rate swaps, for 2009 was 3.95%. In 2010, all of the remaining outstanding notes were called for early redemption.
Pound Sterling Notes
The Pound Sterling notes were issued in 2001 with a principal balance of £500 million, accrue interest at a 5.50% fixed rate, and are due on February 12, 2031. In May 2007, we completed an exchange offer for the existing notes. Holders of £434 million of the notes accepted the exchange offer, and as a result, these notes were exchanged for new notes with a principal amount of £455 million, bearing interest at 5.13% and due in February 2050. The new notes are callable at our option at a redemption price equal to the greater of 100% of the principal amount and accrued interest, or the sum of the present values of the remaining scheduled payout of principal and interest thereon discounted to the date of redemption at a benchmark U.K. government bond yield plus 15 basis points and accrued interest. The £66 million of existing notes that were not exchanged continue to bear interest at 5.50% and are due in 2031. We maintain cross-currency interest rate swaps to hedge the foreign currency risk associated with the bond cash flows. The average fixed interest rate payable on the swaps is 5.72%.
Other Debt
The other debt balance primarily relates to loans entered into in conjunction with our investment in various partnerships. Substantially all of this debt is classified as a current liability. The implied interest rates on this debt range from 5.20% to 6.40%.
Contractual Commitments
We lease certain aircraft, facilities, land, equipment and vehicles under operating leases, which expire at various dates through 2055. Certain of the leases contain escalation clauses and renewal or purchase options. Rent expense related to our operating leases was $615, $622, and $834 million for 2010, 2009, and 2008, respectively.
The following table sets forth the aggregate minimum lease payments under capital and operating leases, the aggregate annual principal payments due under our long-term debt, and the aggregate amounts expected to be spent for purchase commitments (in millions).
| Year |
Capital Leases |
Operating Leases |
Debt Principal |
Purchase Commitments |
||||||||||||
| 2011 |
$ | 18 | $ | 348 | $ | 345 | $ | 642 | ||||||||
| 2012 |
19 | 268 | — | 463 | ||||||||||||
| 2013 |
19 | 205 | 1,750 | 425 | ||||||||||||
| 2014 |
20 | 150 | 1,000 | 16 | ||||||||||||
| 2015 |
21 | 113 | 100 | — | ||||||||||||
| After 2015 |
112 | 431 | 7,363 | — | ||||||||||||
| Total |
209 | $ | 1,515 | $ | 10,558 | $ | 1,546 | |||||||||
| Less: imputed interest |
(49 | ) | ||||||||||||||
| Present value of minimum capitalized lease payments |
160 | |||||||||||||||
| Less: current portion |
(10 | ) | ||||||||||||||
| Long-term capitalized lease obligations |
$ | 150 | ||||||||||||||
88
UNITED PARCEL SERVICE, INC. AND SUBSIDIARIES
NOTES TO CONSOLIDATED FINANCIAL STATEMENTS—(Continued)
As of December 31, 2010, we had outstanding letters of credit totaling approximately $1.580 billion issued in connection with our self-insurance reserves and other routine business requirements. We also issue surety bonds as an alternative to letters of credit in certain instances, and as of December 31, 2010, we had $577 million of surety bonds written.
Available Credit
We maintain two credit agreements with a consortium of banks. One of these agreements provides revolving credit facilities of $1.5 billion, and expires on April 14, 2011. Interest on any amounts we borrow under this facility would be charged at 90-day LIBOR plus a percentage determined by quotations from Markit Group Ltd. for our 1-year credit default swap spread, subject to certain minimum rates and maximum rates based on our public debt ratings from Standard & Poor’s and Moody’s. If our public debt ratings are A / A2 or above, the minimum applicable margin is 0.50% and the maximum applicable margin is 1.50%; if our public debt ratings are lower than A / A2, the minimum applicable margin is 1.00% and the maximum applicable margin is 2.50%.
The second agreement provides revolving credit facilities of $1.0 billion, and expires on April 19, 2012. Interest on any amounts we borrow under this facility would be charged at 90-day LIBOR plus 15 basis points. At December 31, 2010, there were no outstanding borrowings under either of these facilities.
Our existing debt instruments and credit facilities do not have cross-default or ratings triggers, however these debt instruments and credit facilities do subject us to certain financial covenants. As of December 31, 2010 and for all prior periods presented, we have satisfied these financial covenants. These covenants limit the amount of secured indebtedness that we may incur, and limit the amount of attributable debt in sale-leaseback transactions, to 10% of net tangible assets. As of December 31, 2010, 10% of net tangible assets is equivalent to $2.501 billion, however we have no covered sale-leaseback transactions or secured indebtedness outstanding. Additionally, we are required to maintain a minimum net worth, as defined, of $5.0 billion on a quarterly basis. As of December 31, 2010, our net worth, as defined, was equivalent to $14.174 billion. We do not expect these covenants to have a material impact on our financial condition or liquidity.
Fair Value of Debt
Based on the borrowing rates currently available to the Company for long-term debt with similar terms and maturities, the fair value of long-term debt, including current maturities, is approximately $11.355 and $10.216 billion as of December 31, 2010 and 2009, respectively.
NOTE 8. LEGAL PROCEEDINGS AND CONTINGENCIES
We are a defendant in a number of lawsuits filed in state and federal courts containing various class action allegations under state wage-and-hour laws. In one of these cases, Marlo v. UPS, which was certified as a class action in a California federal court in September 2004, plaintiffs allege that they improperly were denied overtime, and seek penalties for missed meal and rest periods, and interest and attorneys’ fees. Plaintiffs purport to represent a class of 1,300 full-time supervisors. In August 2005, the court granted summary judgment in favor of UPS on all claims, and plaintiffs appealed the ruling. In October 2007, the appeals court reversed the lower court’s ruling. In April 2008, the Court decertified the class and vacated the trial scheduled for that month. After decertification, some plaintiffs filed individual lawsuits raising the same allegations as in the underlying class action. These individual lawsuits are in various stages. We have denied any liability with respect to these claims and intend to vigorously defend ourselves in these cases. At this time, we have not determined the amount of any liability that may result from these matters or whether such liability, if any, would have a material adverse effect on our financial condition, results of operations, or liquidity.
89
UNITED PARCEL SERVICE, INC. AND SUBSIDIARIES
NOTES TO CONSOLIDATED FINANCIAL STATEMENTS—(Continued)
UPS and our subsidiary Mail Boxes Etc., Inc. are defendants in various lawsuits brought by franchisees who operate Mail Boxes Etc. centers and The UPS Store locations. These lawsuits relate to the rebranding of Mail Boxes Etc. centers to The UPS Store, The UPS Store business model, the representations made in connection with the rebranding and the sale of The UPS Store franchises, and UPS’s sale of services in the franchisees’ territories. In one of the actions, which is pending in California state court, the court certified a class consisting of all Mail Boxes Etc. branded stores that rebranded to The UPS Store in March 2003. We have denied any liability with respect to these claims and intend to defend ourselves vigorously. At this time, we have not determined the amount of any liability that may result from these matters or whether such liability, if any, would have a material adverse effect on our financial condition, results of operations or liquidity.
In Barber Auto Sales v. UPS, which a federal court in Alabama certified as a class action in September 2009, the plaintiff asserts a breach of contract claim arising from UPS’s assessment of shipping charge corrections when UPS determines that the “dimensional weight” of packages is greater than reported by the shipper. We have denied any liability with respect to these claims and intend to vigorously defend ourselves in this case. At this time, we have not determined the amount of any liability that may result from this matter or whether such liability, if any, would have a material adverse effect on our financial condition, results of operations or liquidity.
In AFMS LLC v. UPS and FedEx Corporation, a lawsuit filed in federal court in the Central District of California in August 2010, the plaintiff asserts that UPS and FedEx violated U.S. antitrust law by conspiring to refuse to negotiate with third party negotiators retained by shippers and/or to monopolize a so-called market for the time sensitive delivery of letters and packages. The Antitrust Division of the U.S. Department of Justice (“DOJ”) has informed us that it has opened a civil investigation of our policies and practices for dealing with third party negotiators. We are cooperating with this investigation. We deny any liability with respect to these matters and intend to vigorously defend ourselves. At this time, we have not determined the amount of any liability that may result from these matters or whether such liability, if any, would have a material adverse effect on our financial condition, results of operations or liquidity.
We are a defendant in various other lawsuits that arose in the normal course of business. We believe that the eventual resolution of these cases will not have a material adverse effect on our financial condition, results of operations or liquidity.
As of December 31, 2010, we had approximately 250,000 employees employed under a national master agreement and various supplemental agreements with local unions affiliated with the International Brotherhood of Teamsters (“Teamsters”). These agreements run through July 31, 2013. We have approximately 2,800 pilots who are employed under a collective bargaining agreement with the Independent Pilots Association (“IPA”), which becomes amendable at the end of 2011. Our airline mechanics are covered by a collective bargaining agreement with Teamsters Local 2727, which became amendable in November 2006. We began formal negotiations with Teamsters Local 2727 in October 2006, and have been under the guidance of the National Mediation Board since January 2008. In January 2011, we reached a tentative agreement with Teamsters Local 2727 which will run through November 1, 2013 when ratified. In addition, the majority (approximately 3,300) of our ground mechanics who are not employed under agreements with the Teamsters are employed under collective bargaining agreements with the International Association of Machinists and Aerospace Workers (“IAM”). Our agreement with the IAM runs through July 31, 2014.
We participate in a number of trustee-managed multi-employer pension and health and welfare plans for employees covered under collective bargaining agreements. Several factors could cause us to make significantly
90
UNITED PARCEL SERVICE, INC. AND SUBSIDIARIES
NOTES TO CONSOLIDATED FINANCIAL STATEMENTS—(Continued)
higher future contributions to these plans, including unfavorable investment performance, changes in demographics, and increased benefits to participants. At this time, we are unable to determine the amount of additional future contributions, if any, or whether any material adverse effect on our financial condition, results of operations, or liquidity would result from our participation in these plans.
In January 2008, a class action complaint was filed in the United States District Court for the Eastern District of New York alleging price-fixing activities relating to the provision of freight forwarding services. UPS was not named in this case. On July 21, 2009, the plaintiffs filed a first amended complaint naming numerous global freight forwarders as defendants. UPS and UPS Supply Chain Solutions are among the 60 defendants named in the amended complaint. We intend to vigorously defend ourselves in this case. At this time, we have not determined the amount of any liability that may result from these matters or whether such liability, if any, would have a material adverse effect on our financial condition, results of operations or liquidity.
Other Matters
We received a grand jury subpoena from the Antitrust Division of the DOJ regarding the DOJ’s investigation into certain pricing practices in the freight forwarding industry in December 2007.
In October 2007, June 2008, and February 2009, we received information requests from the European Commission (“Commission”) relating to its investigation of certain pricing practices in the freight forwarding industry, and subsequently responded to each request. On February 9, 2010, UPS received a Statement of Objections by the Commission. This document contains the Commission’s preliminary view with respect to alleged anticompetitive behavior in the freight forwarding industry by 18 freight forwarders, including UPS. Although it alleges anticompetitive behavior, it does not prejudge the Commission’s final decision, as to facts or law (which is subject to appeal to the European courts). The options available to the Commission include taking no action or imposing a monetary fine; the range of any potential action by the Commission is not reasonably estimable. Any decision imposing a fine would be subject to appeal. UPS has responded to the Statement of Objections, including at a July 2010 Commission hearing, and we intend to continue to vigorously defend ourselves in this proceeding. We received an additional information request from the Commission in January 2011, and will respond in due course.
In August 2010, competition authorities in Brazil opened an administrative proceeding to investigate alleged anticompetitive behavior in the freight forwarding industry. Approximately 45 freight forwarding companies and individuals are named in the proceeding, including UPS, UPS SCS Transportes (Brasil) S.A., and a former employee in Brazil. UPS will have an opportunity to respond to these allegations.
We also received and responded to related information requests from competition authorities in other jurisdictions.
We are cooperating with each of these investigations, and intend to continue to vigorously defend ourselves. At this time, we are unable to determine the amount of any liability that may result from these matters or whether any such liability would have a material adverse effect on our financial condition, results of operations or liquidity.
91
UNITED PARCEL SERVICE, INC. AND SUBSIDIARIES
NOTES TO CONSOLIDATED FINANCIAL STATEMENTS—(Continued)
NOTE 9. SHAREOWNERS’ EQUITY
Capital Stock, Additional Paid-In Capital, and Retained Earnings
We maintain two classes of common stock, which are distinguished from each other by their respective voting rights. Class A shares of UPS are entitled to 10 votes per share, whereas class B shares are entitled to one vote per share. Class A shares are primarily held by UPS employees and retirees, and these shares are fully convertible into class B shares at any time. Class B shares are publicly traded on the New York Stock Exchange (NYSE) under the symbol “UPS.” Class A and B shares both have a $0.01 par value, and as of December 31, 2010, there were 4.6 billion class A shares and 5.6 billion class B shares authorized to be issued. Additionally, there are 200 million preferred shares authorized to be issued, with a par value of $0.01 per share; as of December 31, 2010, no preferred shares had been issued.
The following is a rollforward of our common stock, additional paid-in capital, and retained earnings accounts (in millions, except per share amounts):
| 2010 | 2009 | 2008 | ||||||||||||||||||||||
| Shares | Dollars | Shares | Dollars | Shares | Dollars | |||||||||||||||||||
| Class A Common Stock |
||||||||||||||||||||||||
| Balance at beginning of year |
285 | $ | 3 | 314 | $ | 3 | 349 | $ | 3 | |||||||||||||||
| Common stock purchases |
(6 | ) | — | (10 | ) | — | (11 | ) | — | |||||||||||||||
| Stock award plans |
6 | — | 5 | — | 6 | — | ||||||||||||||||||
| Common stock issuances |
3 | — | 4 | — | 3 | — | ||||||||||||||||||
| Conversions of class A to class B common stock |
(30 | ) | — | (28 | ) | — | (33 | ) | — | |||||||||||||||
| Class A shares issued at end of year |
258 | $ | 3 | 285 | $ | 3 | 314 | $ | 3 | |||||||||||||||
| Class B Common Stock |
||||||||||||||||||||||||
| Balance at beginning of year |
711 | $ | 7 | 684 | $ | 7 | 694 | $ | 7 | |||||||||||||||
| Common stock purchases |
(6 | ) | — | (1 | ) | — | (43 | ) | — | |||||||||||||||
| Conversions of class A to class B common stock |
30 | — | 28 | — | 33 | — | ||||||||||||||||||
| Class B shares issued at end of year |
735 | $ | 7 | 711 | $ | 7 | 684 | $ | 7 | |||||||||||||||
| Additional Paid-In Capital |
||||||||||||||||||||||||
| Balance at beginning of year |
$ | 2 | $ | — | $ | — | ||||||||||||||||||
| Stock award plans |
398 | 381 | 497 | |||||||||||||||||||||
| Common stock purchases |
(649 | ) | (569 | ) | (694 | ) | ||||||||||||||||||
| Common stock issuances |
249 | 190 | 197 | |||||||||||||||||||||
| Balance at end of year |
$ | — | $ | 2 | $ | — | ||||||||||||||||||
| Retained Earnings |
||||||||||||||||||||||||
| Balance at beginning of year |
$ | 12,745 | $ | 12,412 | $ | 14,186 | ||||||||||||||||||
| Net income attributable to controlling interests |
3,488 | 2,152 | 3,003 | |||||||||||||||||||||
| Cumulative adjustment for accounting changes |
— | — | (60 | ) | ||||||||||||||||||||
| Dividends ($1.88, $1.80, and $1.68 per share) |
(1,909 | ) | (1,819 | ) | (1,853 | ) | ||||||||||||||||||
| Common stock purchases |
(160 | ) | — | (2,864 | ) | |||||||||||||||||||
| Balance at end of year |
$ | 14,164 | $ | 12,745 | $ | 12,412 | ||||||||||||||||||
92
UNITED PARCEL SERVICE, INC. AND SUBSIDIARIES
NOTES TO CONSOLIDATED FINANCIAL STATEMENTS—(Continued)
On January 1, 2008, we recognized a $44 million reduction to retained earnings as a result of changing our measurement date under new accounting guidance related to retirement benefits. Also on January 1, 2008, we recognized a $16 million reduction to retained earnings as a result of adopting a new accounting standard for financial instruments. These accounting changes are discussed further in Note 1.
For the years ended December 31, 2010, 2009 and 2008, we repurchased a total of 12.4, 10.9 and 53.6 million shares of class A and class B common stock for $809 million, $569 million and $3.558 billion, respectively. In January 2008, our Board of Directors authorized an increase in our share repurchase authority to $10.0 billion. Unless terminated earlier by the resolution of our Board, the program will expire when we have purchased all shares authorized for repurchase under the program. As of December 31, 2010, we had $5.194 billion of our share repurchase authorization remaining.
Accumulated Other Comprehensive Income (Loss)
We incur activity in AOCI for unrealized holding gains and losses on available-for-sale securities, foreign currency translation adjustments, unrealized gains and losses from derivatives that qualify as hedges of cash flows, and unrecognized pension and postretirement benefit costs. The activity in AOCI is as follows (in millions):
| 2010 | 2009 | 2008 | ||||||||||
| Foreign currency translation gain (loss): |
||||||||||||
| Balance at beginning of year |
$ | 37 | $ | (38 | ) | $ | 81 | |||||
| Aggregate adjustment for the year |
(105 | ) | 75 | (119 | ) | |||||||
| Balance at end of year |
(68 | ) | 37 | (38 | ) | |||||||
| Unrealized gain (loss) on marketable securities, net of tax: |
||||||||||||
| Balance at beginning of year |
(27 | ) | (60 | ) | 9 | |||||||
| Current period changes in fair value (net of tax effect of $17, $3, and $(33)) |
30 | 25 | (78 | ) | ||||||||
| Reclassification to earnings (net of tax effect of $6, $5, and $5) |
9 | 8 | 9 | |||||||||
| Balance at end of year |
12 | (27 | ) | (60 | ) | |||||||
| Unrealized gain (loss) on cash flow hedges, net of tax: |
||||||||||||
| Balance at beginning of year |
(200 | ) | (107 | ) | (250 | ) | ||||||
| Current period changes in fair value (net of tax effect of $(4), $4, and $(33)) |
(7 | ) | 6 | (54 | ) | |||||||
| Reclassification to earnings (net of tax effect of $(19), $(60), and $118) |
(32 | ) | (99 | ) | 197 | |||||||
| Balance at end of year |
(239 | ) | (200 | ) | (107 | ) | ||||||
| Unrecognized pension and postretirement benefit costs, net of tax: |
||||||||||||
| Balance at beginning of year |
(4,937 | ) | (5,437 | ) | (1,853 | ) | ||||||
| Reclassification to earnings (net of tax effect of $104, $93, and $81) |
170 | 156 | 133 | |||||||||
| Net actuarial gain (loss) and prior service cost resulting from remeasurements of plan assets and liabilities (net of tax effect of $(670), $214, and $(2,235)) |
(1,133 | ) | 344 | (3,717 | ) | |||||||
| Balance at end of year |
(5,900 | ) | (4,937 | ) | (5,437 | ) | ||||||
| Accumulated other comprehensive income (loss) at end of year |
$ | (6,195 | ) | $ | (5,127 | ) | $ | (5,642 | ) | |||
93
UNITED PARCEL SERVICE, INC. AND SUBSIDIARIES
NOTES TO CONSOLIDATED FINANCIAL STATEMENTS—(Continued)
Deferred Compensation Obligations and Treasury Stock
We maintain a deferred compensation plan whereby certain employees were previously able to elect to defer the gains on stock option exercises by deferring the shares received upon exercise into a rabbi trust. The shares held in this trust are classified as treasury stock, and the liability to participating employees is classified as “deferred compensation obligations” in the shareowners’ equity section of the balance sheet. The number of shares needed to settle the liability for deferred compensation obligations is included in the denominator in both the basic and diluted earnings per share calculations. Employees are generally no longer able to defer the gains from stock options exercised subsequent to December 31, 2004. Activity in the deferred compensation program for the years ended December 31, 2010, 2009, and 2008 is as follows (in millions):
| 2010 | 2009 | 2008 | ||||||||||||||||||||||
| Shares | Dollars | Shares | Dollars | Shares | Dollars | |||||||||||||||||||
| Deferred Compensation Obligations |
||||||||||||||||||||||||
| Balance at beginning of year |
$ | 108 | $ | 121 | $ | 137 | ||||||||||||||||||
| Reinvested dividends |
4 | 3 | 5 | |||||||||||||||||||||
| Options exercise deferrals |
1 | — | — | |||||||||||||||||||||
| Benefit payments |
(10 | ) | (16 | ) | (21 | ) | ||||||||||||||||||
| Balance at end of year |
$ | 103 | $ | 108 | $ | 121 | ||||||||||||||||||
| Treasury Stock |
||||||||||||||||||||||||
| Balance at beginning of year |
(2 | ) | $ | (108 | ) | (2 | ) | $ | (121 | ) | (2 | ) | $ | (137 | ) | |||||||||
| Reinvested dividends |
— | (4 | ) | — | (3 | ) | — | (5 | ) | |||||||||||||||
| Options exercise deferrals |
— | (1 | ) | — | — | — | — | |||||||||||||||||
| Benefit payments |
— | 10 | — | 16 | — | 21 | ||||||||||||||||||
| Balance at end of year |
(2 | ) | $ | (103 | ) | (2 | ) | $ | (108 | ) | (2 | ) | $ | (121 | ) | |||||||||
Noncontrolling Interests
We have noncontrolling interests in certain consolidated subsidiaries in our International Package and Supply Chain & Freight segments. The noncontrolling interests acquired in 2009 primarily relate to the formation of a joint venture in Dubai that will operate in the Middle East, Turkey, and portions of the Central Asia region, as discussed in Note 6. The activity related to our noncontrolling interests is presented below (in millions):
| 2010 | 2009 | |||||||
| Noncontrolling Interests |
||||||||
| Balance at beginning of period |
$ | 66 | $ | — | ||||
| Acquired noncontrolling interests |
2 | 66 | ||||||
| Dividends attributable to noncontrolling interests |
— | — | ||||||
| Net income attributable to noncontrolling interests |
— | — | ||||||
| Balance at end of period |
$ | 68 | $ | 66 | ||||
NOTE 10. STOCK-BASED COMPENSATION
Incentive Compensation Plan
The UPS Incentive Compensation Plan permits the grant of nonqualified and incentive stock options, stock appreciation rights, restricted stock and stock units, restricted performance shares and units, and management incentive awards to eligible employees. The number of shares reserved for issuance under the Incentive Compensation Plan is 80 million. Each share issued pursuant to an option and each share issued subject to the
94
UNITED PARCEL SERVICE, INC. AND SUBSIDIARIES
NOTES TO CONSOLIDATED FINANCIAL STATEMENTS—(Continued)
exercised portion of a stock appreciation right will reduce the share reserve by one share. Each share issued pursuant to restricted stock and stock units, and restricted performance shares and units, will reduce the share reserve by 2.76 shares. As of December 31, 2010, management incentive awards, stock options, restricted performance units, and restricted stock units had been granted under the Incentive Compensation Plan. We had 48 million shares available to be issued under the Incentive Compensation Plan as of December 31, 2010.
Management Incentive Awards & Restricted Stock Units
Persons earning the right to receive management incentive awards are determined annually by the Compensation Committee of the UPS Board of Directors. Our management incentive awards program provides that half of the annual management incentive award, with certain exceptions, be made in restricted stock units (“RSUs”), which generally vest over a five-year period. The other half of the award is in the form of cash or unrestricted shares of class A common stock and is fully vested at the time of grant. These management incentive awards are generally granted in the fourth quarter of each year.
Upon vesting, RSUs result in the issuance of the equivalent number of UPS class A common shares after required tax withholdings. Except in the case of death, disability, or retirement, RSUs granted for our management incentive awards generally vest over a five year period with approximately 20% of the award vesting at each anniversary date of the grant. The entire grant is expensed on a straight-line basis over the requisite service period. All RSUs granted are subject to earlier cancellation or vesting under certain conditions. Dividends earned on management incentive award RSUs are reinvested in additional RSUs at each dividend payable date.
We also award RSUs in conjunction with our long-term incentive performance awards program to certain eligible employees. The RSUs ultimately granted under the long-term incentive performance award will be based upon the achievement of certain performance measures, including growth in consolidated revenue and operating return on invested capital, each year during the performance award cycle, and other measures, including growth in consolidated earnings per share, over the entire three year performance award cycle.
As of December 31, 2010, we had the following RSUs outstanding, including reinvested dividends:
| Shares (in thousands) |
Weighted Average Grant Date Fair Value |
Weighted Average Remaining Contractual Term (in years) |
Aggregate Intrinsic Value (in millions) |
|||||||||||||
| Nonvested at January 1, 2010 |
13,881 | $ | 58.82 | |||||||||||||
| Vested |
(5,801 | ) | 62.33 | |||||||||||||
| Granted |
5,966 | 66.11 | ||||||||||||||
| Reinvested Dividends |
404 | N/A | ||||||||||||||
| Forfeited / Expired |
(339 | ) | 57.16 | |||||||||||||
| Nonvested at December 31, 2010 |
14,111 | $ | 60.51 | 2.06 | $ | 1,024 | ||||||||||
| RSUs Expected to Vest |
13,649 | $ | 60.49 | 2.01 | $ | 991 | ||||||||||
The fair value of each RSU is the New York Stock Exchange (“NYSE”) closing price on the date of grant. The weighted-average grant date fair value of RSUs granted during 2010, 2009, and 2008 was $66.11, $56.57, and $46.56, respectively. The total fair value of RSUs vested was $368, $246, and $141 million in 2010, 2009, and 2008, respectively. As of December 31, 2010, there was $620 million of total unrecognized compensation cost related to nonvested RSUs. That cost is expected to be recognized over a weighted average period of 3 years and 8 months.
95
UNITED PARCEL SERVICE, INC. AND SUBSIDIARIES
NOTES TO CONSOLIDATED FINANCIAL STATEMENTS—(Continued)
Nonqualified Stock Options
We maintain fixed stock option plans, under which options are granted to purchase shares of UPS class A common stock. Stock options granted in connection with the Incentive Compensation Plan must have an exercise price at least equal to the NYSE closing price of UPS class B common stock on the date the option is granted.
Persons earning the right to receive stock options are determined each year by the Compensation Committee. Except in the case of death, disability, or retirement, options granted under the Incentive Compensation Plan prior to 2008 are generally exercisable three to five years from the date of grant and before the expiration of the option 10 years after the date of grant. Beginning in 2008, option awards have been made to a more limited group of employees, and options granted will generally vest over a five year period with approximately 20% of the award vesting at each anniversary date of the grant. All options granted are subject to earlier cancellation or exercise under certain conditions. Option holders may exercise their options via the tender of cash or class A common stock, and new class A shares are issued upon exercise. Options granted to eligible employees will generally be granted annually during the second quarter of each year at the discretion of the Compensation Committee.
The following is an analysis of options to purchase shares of class A common stock issued and outstanding:
| Shares (in thousands) |
Weighted Average Exercise Price |
Weighted Average Remaining Contractual Term (in years) |
Aggregate Intrinsic Value (in millions) |
|||||||||||||
| Outstanding at January 1, 2010 |
17,198 | $ | 67.52 | |||||||||||||
| Exercised |
(1,819 | ) | 58.48 | |||||||||||||
| Granted |
184 | 67.18 | ||||||||||||||
| Forfeited / Expired |
(261 | ) | 66.16 | |||||||||||||
| Outstanding at December 31, 2010 |
15,302 | $ | 68.62 | 3.87 | $ | 79 | ||||||||||
| Options Vested and Expected to Vest |
15,181 | $ | 68.52 | 3.85 | $ | 79 | ||||||||||
| Exercisable at December 31, 2010 |
11,193 | $ | 66.68 | 3.01 | $ | 71 | ||||||||||
The fair value of each option grant is estimated using the Black-Scholes option pricing model. The weighted average assumptions used, by year, and the calculated weighted average fair values of options are as follows:
| 2010 | 2009 | 2008 | ||||||||||
| Expected dividend yield |
2.70 | % | 3.25 | % | 2.39 | % | ||||||
| Risk-free interest rate |
3.30 | % | 3.22 | % | 3.79 | % | ||||||
| Expected life in years |
7.5 | 7.5 | 7.5 | |||||||||
| Expected volatility |
23.59 | % | 23.16 | % | 22.24 | % | ||||||
| Weighted average fair value of options granted |
$ | 14.83 | $ | 10.86 | $ | 16.77 | ||||||
Expected volatilities are based on the historical returns on our stock and the implied volatility of our publicly-traded options. The expected dividend yield is based on the recent historical dividend yields for our stock, taking into account changes in dividend policy. The risk-free interest rate is based on the term structure of interest rates at the time of the option grant. The expected life represents an estimate of the period of time options are expected to remain outstanding, and we have relied upon a combination of the observed exercise behavior of our prior grants with similar characteristics, the vesting schedule of the grants, and an index of peer companies with similar grant characteristics.
96
UNITED PARCEL SERVICE, INC. AND SUBSIDIARIES
NOTES TO CONSOLIDATED FINANCIAL STATEMENTS—(Continued)
We received cash of $60, $27, and $46 million during 2010, 2009, and 2008, respectively, from option holders resulting from the exercise of stock options. We received a tax benefit of $4, $1, and $4 million during 2010, 2009, and 2008, respectively, from the exercise of stock options, which is reported as cash from financing activities in the cash flow statement.
The total intrinsic value of options exercised during 2010, 2009, and 2008 was $18, $5, and $13 million, respectively. As of December 31, 2010, there was $11 million of total unrecognized compensation cost related to nonvested options. That cost is expected to be recognized over a weighted average period of 1 year and 6 months.
The following table summarizes information about stock options outstanding and exercisable at December 31, 2010:
| Options Outstanding | Options Exercisable | |||||||||||||||||||
| Exercise Price Range |
Shares (in thousands) |
Average Life (in years) |
Average Exercise Price |
Shares (in thousands) |
Average Exercise Price |
|||||||||||||||
| $50.01 - $60.00 |
1,302 | 1.81 | 56.68 | 1,098 | 56.83 | |||||||||||||||
| $60.01 - $70.00 |
4,396 | 2.16 | 61.58 | 4,211 | 61.34 | |||||||||||||||
| $70.01 - $80.00 |
7,393 | 4.82 | 71.22 | 5,279 | 71.34 | |||||||||||||||
| $80.01 - $90.00 |
2,211 | 5.33 | 80.92 | 605 | 81.01 | |||||||||||||||
| 15,302 | 3.87 | $ | 68.62 | 11,193 | $ | 66.68 | ||||||||||||||
Restricted Performance Units
We issue restricted performance units (“RPUs”) under the Incentive Compensation Plan. Upon vesting, RPUs result in the issuance of the equivalent number of UPS class A common shares after required tax withholdings. Persons earning the right to receive RPUs are determined each year by the Compensation Committee. Except in the case of death, disability, or retirement, all RPUs granted prior to 2008 vest five years after the date of grant. Beginning in 2008, RPU awards granted will generally vest over a five year period with approximately 20% of the award vesting at each anniversary date of the grant. All RPUs granted are subject to earlier cancellation or vesting under certain conditions. Dividends earned on RPUs are reinvested in additional restricted performance units at each dividend payable date. RPUs granted to eligible employees will generally be granted annually during the second quarter of each year at the discretion of the Compensation Committee.
As of December 31, 2010, we had the following RPUs outstanding, including reinvested dividends:
| Shares (in thousands) |
Weighted Average Grant Date Fair Value |
Weighted Average Remaining Contractual Term (in years) |
Aggregate Intrinsic Value (in millions) |
|||||||||||||
| Nonvested at January 1, 2010 |
6,361 | $ | 67.25 | |||||||||||||
| Vested |
(2,611 | ) | 67.99 | |||||||||||||
| Granted |
2,088 | 67.18 | ||||||||||||||
| Reinvested Dividends |
207 | N/A | ||||||||||||||
| Forfeited / Expired |
(127 | ) | 66.77 | |||||||||||||
| Nonvested at December 31, 2010 |
5,918 | $ | 67.11 | 1.64 | $ | 430 | ||||||||||
| RPUs Expected to Vest |
6,029 | $ | 67.15 | 1.66 | $ | 438 | ||||||||||
97
UNITED PARCEL SERVICE, INC. AND SUBSIDIARIES
NOTES TO CONSOLIDATED FINANCIAL STATEMENTS—(Continued)
The fair value of each RPU is the NYSE closing price on the date of grant. The weighted-average grant date fair value of RPUs granted during 2010, 2009, and 2008 was $67.18, $55.83, and $71.06, respectively. The total fair value of RPUs vested during 2010, 2009, and 2008 was $155, $72, and $83 million, respectively. As of December 31, 2010, there was $186 million of total unrecognized compensation cost related to nonvested RPUs. That cost is expected to be recognized over a weighted average period of 3 years and 4 months.
Discounted Employee Stock Purchase Plan
We maintain an employee stock purchase plan for all eligible employees, which was modified in 2009. Under the modified plan, shares of UPS class A common stock may be purchased at quarterly intervals at 95% of the NYSE closing price of UPS class B common stock on the last day of each quarterly period. Prior to the modification in the second quarter of 2009, shares could be purchased at quarterly intervals at 90% of the lower of the NYSE closing price of the UPS class B common stock on the first or the last day of each quarterly period. Employees purchased 1.5, 0.6, and 1.9 million shares at average prices of $57.98, $44.30, and $55.27 per share during 2010, 2009, and 2008, respectively. Subsequent to the modification, the plan is no longer considered to be compensatory, and therefore no compensation cost is measured for the modified employees’ purchase rights. Prior to the modification, compensation cost was measured for the fair value of employees’ purchase rights under our discounted employee stock purchase plan using the Black-Scholes option pricing model, and we determined the weighted average fair value of the employee purchase rights to be $7.52 and $8.85 per share for 2009 and 2008, respectively.
NOTE 11. SEGMENT AND GEOGRAPHIC INFORMATION
We report our operations in three segments: U.S. Domestic Package operations, International Package operations, and Supply Chain & Freight operations. Package operations represent our most significant business and are broken down into regional operations around the world. Regional operations managers are responsible for both domestic and export operations within their geographic area.
U.S. Domestic Package
Domestic Package operations include the time-definite delivery of letters, documents, and packages throughout the United States.
International Package
International Package operations include delivery to more than 220 countries and territories worldwide, including shipments wholly outside the United States, as well as shipments with either origin or distribution outside the United States. Our International Package reporting segment includes the operations of our Europe, Asia, and Americas operating segments.
Supply Chain & Freight
Supply Chain & Freight includes our forwarding and logistics operations, UPS Freight, and other aggregated business units. Our forwarding and logistics business provides services in more than 195 countries and territories worldwide, and includes supply chain design and management, freight distribution, customs brokerage, mail and consulting services. UPS Freight offers a variety of LTL and TL services to customers in North America. Other aggregated business units within this segment include Mail Boxes Etc. (the franchisor of Mail Boxes Etc. and The UPS Store) and UPS Capital.
98
UNITED PARCEL SERVICE, INC. AND SUBSIDIARIES
NOTES TO CONSOLIDATED FINANCIAL STATEMENTS—(Continued)
In evaluating financial performance, we focus on operating profit as a segment’s measure of profit or loss. Operating profit is before investment income, interest expense, and income taxes. The accounting policies of the reportable segments are the same as those described in the summary of accounting policies (see Note 1), with certain expenses allocated between the segments using activity-based costing methods. Unallocated assets are comprised primarily of cash, marketable securities, and certain investment partnerships.
Segment information as of, and for the years ended, December 31 is as follows (in millions):
| 2010 | 2009 | 2008 | ||||||||||
| Revenue: |
||||||||||||
| U.S. Domestic Package |
$ | 29,742 | $ | 28,158 | $ | 31,278 | ||||||
| International Package |
11,133 | 9,699 | 11,293 | |||||||||
| Supply Chain & Freight |
8,670 | 7,440 | 8,915 | |||||||||
| Consolidated |
$ | 49,545 | $ | 45,297 | $ | 51,486 | ||||||
| Operating Profit (Loss): |
||||||||||||
| U.S. Domestic Package |
$ | 3,373 | $ | 2,138 | $ | 3,907 | ||||||
| International Package |
1,904 | 1,367 | 1,580 | |||||||||
| Supply Chain & Freight |
597 | 296 | (105 | ) | ||||||||
| Consolidated |
$ | 5,874 | $ | 3,801 | $ | 5,382 | ||||||
| Assets: |
||||||||||||
| U.S. Domestic Package |
$ | 18,425 | $ | 18,572 | $ | 18,796 | ||||||
| International Package |
6,228 | 5,882 | 5,723 | |||||||||
| Supply Chain & Freight |
6,283 | 6,620 | 6,775 | |||||||||
| Unallocated |
2,661 | 809 | 585 | |||||||||
| Consolidated |
$ | 33,597 | $ | 31,883 | $ | 31,879 | ||||||
| Depreciation and Amortization Expense: |
||||||||||||
| U.S. Domestic Package |
$ | 1,174 | $ | 1,064 | $ | 1,031 | ||||||
| International Package |
443 | 500 | 588 | |||||||||
| Supply Chain & Freight |
175 | 183 | 195 | |||||||||
| Consolidated |
$ | 1,792 | $ | 1,747 | $ | 1,814 | ||||||
99
UNITED PARCEL SERVICE, INC. AND SUBSIDIARIES
NOTES TO CONSOLIDATED FINANCIAL STATEMENTS—(Continued)
Revenue by product type for the years ended December 31 is as follows (in millions):
| 2010 | 2009 | 2008 | ||||||||||
| U.S. Domestic Package: |
||||||||||||
| Next Day Air |
$ | 5,835 | $ | 5,456 | $ | 6,559 | ||||||
| Deferred |
2,975 | 2,859 | 3,325 | |||||||||
| Ground |
20,932 | 19,843 | 21,394 | |||||||||
| Total U.S. Domestic Package |
29,742 | 28,158 | 31,278 | |||||||||
| International Package: |
||||||||||||
| Domestic |
2,365 | 2,111 | 2,344 | |||||||||
| Export |
8,234 | 7,176 | 8,294 | |||||||||
| Cargo |
534 | 412 | 655 | |||||||||
| Total International Package |
11,133 | 9,699 | 11,293 | |||||||||
| Supply Chain & Freight: |
||||||||||||
| Forwarding and Logistics |
6,022 | 5,080 | 6,293 | |||||||||
| Freight |
2,208 | 1,943 | 2,191 | |||||||||
| Other |
440 | 417 | 431 | |||||||||
| Total Supply Chain & Freight |
8,670 | 7,440 | 8,915 | |||||||||
| Consolidated |
$ | 49,545 | $ | 45,297 | $ | 51,486 | ||||||
Geographic information as of, and for the years ended, December 31 is as follows (in millions):
| 2010 | 2009 | 2008 | ||||||||||
| United States: |
||||||||||||
| Revenue |
$ | 36,795 | $ | 34,375 | $ | 38,553 | ||||||
| Long-lived assets |
$ | 16,693 | $ | 17,336 | $ | 17,422 | ||||||
| International: |
||||||||||||
| Revenue |
$ | 12,750 | $ | 10,922 | $ | 12,933 | ||||||
| Long-lived assets |
$ | 5,047 | $ | 4,935 | $ | 5,136 | ||||||
| Consolidated: |
||||||||||||
| Revenue |
$ | 49,545 | $ | 45,297 | $ | 51,486 | ||||||
| Long-lived assets |
$ | 21,740 | $ | 22,271 | $ | 22,558 | ||||||
Long-lived assets include property, plant and equipment, pension and postretirement benefit assets, long-term investments, goodwill, and intangible assets.
No countries outside of the United States, nor any individual customers, provided 10% or more of consolidated revenue in 2010, 2009 or 2008.
100
UNITED PARCEL SERVICE, INC. AND SUBSIDIARIES
NOTES TO CONSOLIDATED FINANCIAL STATEMENTS—(Continued)
NOTE 12. INCOME TAXES
The income tax expense (benefit) for the years ended December 31 consists of the following (in millions):
| 2010 | 2009 | 2008 | ||||||||||
| Current: |
||||||||||||
| U.S. Federal |
$ | 776 | $ | 715 | $ | 1,510 | ||||||
| U.S. State and Local |
119 | 30 | 173 | |||||||||
| Non-U.S. |
161 | 147 | 155 | |||||||||
| Total Current |
1,056 | 892 | 1,838 | |||||||||
| Deferred: |
||||||||||||
| U.S. Federal |
893 | 231 | 115 | |||||||||
| U.S. State and Local |
106 | 32 | 4 | |||||||||
| Non-U.S. |
(20 | ) | 59 | 55 | ||||||||
| Total Deferred |
979 | 322 | 174 | |||||||||
| Total |
$ | 2,035 | $ | 1,214 | $ | 2,012 | ||||||
Income before income taxes includes the following components (in millions):
| 2010 | 2009 | 2008 | ||||||||||
| United States |
$ | 4,780 | $ | 3,027 | $ | 4,547 | ||||||
| Non-U.S. |
743 | 339 | 468 | |||||||||
| $ | 5,523 | $ | 3,366 | $ | 5,015 | |||||||
A reconciliation of the statutory federal income tax rate to the effective income tax rate for the years ended December 31 consists of the following:
| 2010 | 2009 | 2008 | ||||||||||
| Statutory U.S. federal income tax rate |
35.0 | % | 35.0 | % | 35.0 | % | ||||||
| U.S. state and local income taxes (net of federal benefit) |
2.4 | 1.4 | 2.5 | |||||||||
| Non-U.S. tax rate differential |
(0.7 | ) | (1.5 | ) | 1.0 | |||||||
| Nondeductible/nontaxable items |
0.3 | 0.9 | 5.1 | |||||||||
| U.S. federal tax credits |
(1.8 | ) | (3.2 | ) | (3.0 | ) | ||||||
| Other |
1.6 | 3.5 | (0.5 | ) | ||||||||
| Effective income tax rate |
36.8 | % | 36.1 | % | 40.1 | % | ||||||
In the third quarter of 2010, we recognized a $40 million tax benefit associated with the release of a valuation allowance against deferred tax assets in our international package operations, partially offset by tax provided for interest earned on refunds.
In the first quarter of 2010, we changed the tax status of a German subsidiary that was taxable in the U.S. and its local jurisdiction to one that is taxed solely in its local jurisdiction. This change was made primarily to allow for more flexibility in funding this subsidiary’s operations with local liquidity sources, improve the cash flow position in the U.S., and help mitigate future currency remeasurement risk. As a result of this change in tax status, we recorded a non-cash charge of $76 million, which resulted primarily from the write-off of related deferred tax assets which will not be realizable following the change in tax status.
101
UNITED PARCEL SERVICE, INC. AND SUBSIDIARIES
NOTES TO CONSOLIDATED FINANCIAL STATEMENTS—(Continued)
In the fourth quarter of 2008, we completed our annual goodwill impairment testing and determined that our UPS Freight reporting unit, which was formed through the acquisition of Overnite Corporation in 2005, had a goodwill impairment of $548 million. The impairment was not deductible for tax purposes and therefore negatively impacted our effective tax rate in 2008.
Deferred tax liabilities and assets are comprised of the following at December 31 (in millions):
| 2010 | 2009 | |||||||
| Property, plant and equipment |
$ | 3,335 | $ | 3,141 | ||||
| Goodwill and intangible assets |
853 | 791 | ||||||
| Other |
562 | 401 | ||||||
| Gross deferred tax liabilities |
4,750 | 4,333 | ||||||
| Other postretirement benefits |
1,055 | 990 | ||||||
| Pension plans |
809 | 956 | ||||||
| Loss and credit carryforwards (non-U.S. and state) |
295 | 315 | ||||||
| Insurance reserves |
655 | 634 | ||||||
| Vacation pay accrual |
191 | 186 | ||||||
| Stock compensation |
242 | 244 | ||||||
| Other |
568 | 589 | ||||||
| Gross deferred tax assets |
3,815 | 3,914 | ||||||
| Deferred tax assets valuation allowance |
(207 | ) | (237 | ) | ||||
| Net deferred tax asset |
3,608 | 3,677 | ||||||
| Net deferred tax liability |
$ | 1,142 | $ | 656 | ||||
| Amounts recognized in the balance sheet: |
||||||||
| Current deferred tax assets |
$ | 659 | $ | 585 | ||||
| Current deferred tax liabilities (included in other current liabilities) |
$ | 28 | $ | 2 | ||||
| Non-current deferred tax assets (included in other non-current assets) |
$ | 97 | $ | 54 | ||||
| Non-current deferred tax liabilities |
$ | 1,870 | $ | 1,293 | ||||
The valuation allowance changed by $30, ($120), and ($61) million during the years ended December 31, 2010, 2009 and 2008, respectively.
We have U.S. state and local operating loss and credit carryforwards as follows (in millions):
| 2010 | 2009 | |||||||
| U.S. state and local operating loss carryforwards |
$ | 1,088 | $ | 1,178 | ||||
| U.S. state and local credit carryforwards |
$ | 74 | $ | 65 | ||||
The operating loss carryforwards expire at varying dates through 2030. The state credits can be carried forward for periods ranging from three years to indefinitely.
We also have non-U.S. loss carryforwards of approximately $908 million as of December 31, 2010, the majority of which may be carried forward indefinitely. As indicated in the table above, we have established a valuation allowance for certain non-U.S. and state loss carryforwards, due to the uncertainty resulting from a lack of previous taxable income within the applicable tax jurisdictions.
102
UNITED PARCEL SERVICE, INC. AND SUBSIDIARIES
NOTES TO CONSOLIDATED FINANCIAL STATEMENTS—(Continued)
Undistributed earnings of our non-U.S. subsidiaries amounted to approximately $2.725 billion at December 31, 2010. Those earnings are considered to be indefinitely reinvested and, accordingly, no U.S. federal or state deferred income taxes have been provided thereon. Upon distribution of those earnings in the form of dividends or otherwise, we would be subject to U.S. income taxes and withholding taxes payable in various non-U.S. jurisdictions, which could potentially be offset by foreign tax credits. Determination of the amount of unrecognized deferred U.S. income tax liability is not practicable because of the complexities associated with its hypothetical calculation.
The following table summarizes the activity related to our unrecognized tax benefits (in millions):
| Tax | Interest | Penalties | ||||||||||
| Balance at January 1, 2008 |
$ | 355 | $ | 75 | $ | 6 | ||||||
| Additions for tax positions of the current year |
28 | — | 1 | |||||||||
| Additions for tax positions of prior years |
63 | 33 | 5 | |||||||||
| Reductions for tax positions of prior years for: |
||||||||||||
| Changes based on facts and circumstances |
(46 | ) | (9 | ) | (2 | ) | ||||||
| Settlements during the period |
(9 | ) | (2 | ) | — | |||||||
| Lapses of applicable statute of limitations |
(3 | ) | — | — | ||||||||
| Balance at December 31, 2008 |
388 | 97 | 10 | |||||||||
| Additions for tax positions of the current year |
41 | — | — | |||||||||
| Additions for tax positions of prior years |
76 | 27 | 2 | |||||||||
| Reductions for tax positions of prior years for: |
||||||||||||
| Changes based on facts and circumstances |
(214 | ) | (34 | ) | (3 | ) | ||||||
| Settlements during the period |
(23 | ) | (4 | ) | — | |||||||
| Lapses of applicable statute of limitations |
(2 | ) | — | (1 | ) | |||||||
| Balance at December 31, 2009 |
266 | 86 | 8 | |||||||||
| Additions for tax positions of the current year |
16 | — | — | |||||||||
| Additions for tax positions of prior years |
45 | 25 | 2 | |||||||||
| Reductions for tax positions of prior years for: |
||||||||||||
| Changes based on facts and circumstances |
(27 | ) | (10 | ) | (3 | ) | ||||||
| Settlements during the period |
(6 | ) | (3 | ) | — | |||||||
| Lapses of applicable statute of limitations |
(10 | ) | (3 | ) | — | |||||||
| Balance at December 31, 2010 |
$ | 284 | $ | 95 | $ | 7 | ||||||
The total amount of gross unrecognized tax benefits as of December 31, 2010, 2009 and 2008 that, if recognized, would affect the effective tax rate was $283, $243, and $206 million, respectively. We also had gross recognized tax benefits of $326, $329, and $583 million recorded as of December 31, 2010, 2009 and 2008, respectively, associated with outstanding refund claims for prior tax years. Therefore, we had a net receivable recorded with respect to prior year income tax matters in the accompanying consolidated balance sheets. Additionally, we have recognized a receivable for interest of $32, $56, and $135 million for the recognized tax benefits associated with outstanding refund claims as of December 31, 2010, 2009 and 2008, respectively. Our continuing practice is to recognize interest and penalties associated with income tax matters as a component of income tax expense.
We file income tax returns in the U.S. federal jurisdiction, most U.S. state and local jurisdictions, and many non-U.S. jurisdictions. We have substantially resolved all U.S. federal income tax matters for tax years prior to
103
UNITED PARCEL SERVICE, INC. AND SUBSIDIARIES
NOTES TO CONSOLIDATED FINANCIAL STATEMENTS—(Continued)
2003. During the fourth quarter of 2010, we received a refund of $139 million as a result of the resolution of tax years 2003 through 2004 with the Internal Revenue Service (“IRS”) Appeals Office. Along with the audit for tax years 2005 through 2007, the IRS is currently examining non-income based taxes, including employment and excise taxes, which could lead to proposed assessments. The IRS has not presented an official position with regard to these taxes at this time, and therefore we are not able to determine the technical merit of any potential assessment. We anticipate receipt of the IRS reports on these matters by the end of the second quarter of 2011. We have filed all required U.S. state and local returns reporting the result of the resolution of the U.S. federal income tax audit of the tax years 2003 and 2004. A limited number of U.S. state and local matters are the subject of ongoing audits, administrative appeals or litigation.
A number of years may elapse before an uncertain tax position is audited and ultimately settled. It is difficult to predict the ultimate outcome or the timing of resolution for uncertain tax positions. It is reasonably possible that the amount of unrecognized tax benefits could significantly increase or decrease within the next twelve months. Items that may cause changes to unrecognized tax benefits include the timing of interest deductions and the allocation of income and expense between tax jurisdictions. These changes could result from the settlement of ongoing litigation, the completion of ongoing examinations, the expiration of the statute of limitations, or other unforeseen circumstances. At this time, an estimate of the range of the reasonably possible change cannot be made.
NOTE 13. EARNINGS PER SHARE
The following table sets forth the computation of basic and diluted earnings per share (in millions except per share amounts):
| 2010 | 2009 | 2008 | ||||||||||
| Numerator: |
||||||||||||
| Net income attributable to common shareowners |
$ | 3,488 | $ | 2,152 | $ | 3,003 | ||||||
| Denominator: |
||||||||||||
| Weighted average shares |
991 | 995 | 1,014 | |||||||||
| Deferred compensation obligations |
2 | 2 | 2 | |||||||||
| Vested portion of restricted shares |
1 | 1 | — | |||||||||
| Denominator for basic earnings per share |
994 | 998 | 1,016 | |||||||||
| Effect of dilutive securities: |
||||||||||||
| Restricted performance units |
3 | 2 | 2 | |||||||||
| Restricted stock units |
6 | 4 | 3 | |||||||||
| Stock options |
— | — | 1 | |||||||||
| Denominator for diluted earnings per share |
1,003 | 1,004 | 1,022 | |||||||||
| Basic earnings per share |
$ | 3.51 | $ | 2.16 | $ | 2.96 | ||||||
| Diluted earnings per share |
$ | 3.48 | $ | 2.14 | $ | 2.94 | ||||||
Diluted earnings per share for the years ended December 31, 2010, 2009, and 2008 exclude the effect of 11.1, 17.4, and 11.7 million shares, respectively, of common stock that may be issued upon the exercise of employee stock options because such effect would be antidilutive.
104
UNITED PARCEL SERVICE, INC. AND SUBSIDIARIES
NOTES TO CONSOLIDATED FINANCIAL STATEMENTS—(Continued)
NOTE 14. DERIVATIVE INSTRUMENTS AND RISK MANAGEMENT
Risk Management Policies
We are exposed to market risk, primarily related to foreign exchange rates, commodity prices and interest rates. These exposures are actively monitored by management. To manage the volatility relating to certain of these exposures, we enter into a variety of derivative financial instruments. Our objective is to reduce, where it is deemed appropriate to do so, fluctuations in earnings and cash flows associated with changes in foreign currency rates, commodity prices and interest rates. It is our policy and practice to use derivative financial instruments only to the extent necessary to manage exposures. As we use price sensitive instruments to hedge a certain portion of our existing and anticipated transactions, we expect that any loss in value for those instruments generally would be offset by increases in the value of those hedged transactions. We do not hold or issue derivative financial instruments for trading or speculative purposes.
Credit Risk Management
The forward contracts, swaps, and options discussed below contain an element of risk that the counterparties may be unable to meet the terms of the agreements. However, we minimize such risk exposures for these instruments by limiting the counterparties to banks and financial institutions that meet established credit guidelines, and monitoring counterparty credit risk to prevent concentrations of credit risk with any single counterparty.
We have agreements with some of our counterparties containing early termination rights and bilateral collateral provisions, whereby security is required if market risk exposure exceeds a specified threshold amount or credit ratings fall below certain levels. As of December 31, 2010, we had not posted nor received any collateral under these contractual provisions. The remaining counterparty agreements contain early termination rights but no bilateral collateral provisions.
We have not historically incurred, and do not expect to incur in the future, any losses as a result of counterparty default.
Accounting Policy for Derivative Instruments
We recognize all derivative instruments as assets or liabilities in the balance sheet at fair value. The accounting for changes in the fair value of a derivative instrument depends on whether it has been designated and qualifies as part of a hedging relationship and, further, on the type of hedging relationship. For those derivative instruments that are designated and qualify as hedging instruments, a company must designate the derivative, based upon the exposure being hedged, as a cash flow hedge, a fair value hedge, or a hedge of a net investment in a foreign operation.
A cash flow hedge refers to hedging the exposure to variability in expected future cash flows that is attributable to a particular risk. For derivative instruments that are designated and qualify as a cash flow hedge, the effective portion of the gain or loss on the derivative instrument is reported as a component of AOCI, and reclassified into earnings in the same period during which the hedged transaction affects earnings. The remaining gain or loss on the derivative instrument in excess of the cumulative change in the present value of future cash flows of the hedged item, or hedge components excluded from the assessment of effectiveness, are recognized in the income statement during the current period.
105
UNITED PARCEL SERVICE, INC. AND SUBSIDIARIES
NOTES TO CONSOLIDATED FINANCIAL STATEMENTS—(Continued)
A fair value hedge refers to hedging the exposure to changes in the fair value of an existing asset or liability on the balance sheet that is attributable to a particular risk. For derivative instruments that are designated and qualify as a fair value hedge, the gain or loss on the derivative instrument is recognized in the income statement during the current period, as well as the offsetting gain or loss on the hedged item.
A net investment hedge refers to the use of cross currency swaps, forward contracts, or foreign currency denominated debt to hedge portions of our net investments in foreign operations. For hedges that meet the effectiveness requirements, the net gains or losses attributable to changes in spot exchange rates are recorded in the cumulative translation adjustment within other AOCI. The remainder of the change in value of such instruments is recorded in earnings.
Types of Hedges
Commodity Risk Management
Currently, the fuel surcharges that we apply to our domestic and international package and LTL services are the primary means of reducing the risk of adverse fuel price changes on our business. We periodically enter into option contracts on energy commodity products to manage the price risk associated with forecasted transactions involving refined fuels, principally jet-A, diesel, and unleaded gasoline. The objective of the hedges is to reduce the variability of cash flows, due to changing fuel prices, associated with the forecasted transactions involving those products. We have designated and account for these contracts as cash flow hedges of the underlying forecasted transactions involving these fuel products and, therefore, the resulting gains and losses from these hedges are recognized as a component of fuel expense or revenue when the underlying transactions occur.
Foreign Currency Risk Management
To protect against the reduction in value of forecasted foreign currency cash flows from our international package business, we maintain a foreign currency cash flow hedging program. Our most significant foreign currency exposures relate to the Euro, the British Pound Sterling, and the Canadian Dollar. We hedge portions of our forecasted revenue denominated in foreign currencies with option contracts. We have designated and account for these contracts as cash flow hedges of anticipated foreign currency denominated revenue and, therefore, the resulting gains and losses from these hedges are recognized as a component of international package revenue when the underlying sales transactions occur.
We have foreign currency denominated debt obligations and capital lease obligations associated with our aircraft. For some of these debt obligations and leases, we hedge the foreign currency denominated contractual payments using cross-currency interest rate swaps, which effectively convert the foreign currency denominated contractual payments into U.S. Dollar denominated payments. We have designated and account for these swaps as cash flow hedges of the forecasted contractual payments and, therefore, the resulting gains and losses from these hedges are recognized in the income statement when the currency remeasurement gains and losses on the underlying debt obligations and leases are incurred.
Interest Rate Risk Management
Our indebtedness under our various financing arrangements creates interest rate risk. We use a combination of derivative instruments, including interest rate swaps and cross-currency interest rate swaps, as part of our program to manage the fixed and floating interest rate mix of our total debt portfolio and related overall cost of borrowing. The notional amount, interest payment, and maturity dates of the swaps match the terms of the associated debt being hedged. Interest rate swaps allow us to maintain a target range of floating rate debt within our capital structure.
106
UNITED PARCEL SERVICE, INC. AND SUBSIDIARIES
NOTES TO CONSOLIDATED FINANCIAL STATEMENTS—(Continued)
We have designated and account for interest rate swaps that convert fixed rate interest payments into floating rate interest payments as hedges of the fair value of the associated debt instruments. Therefore, the gains and losses resulting from fair value adjustments to the interest rate swaps and fair value adjustments to the associated debt instruments are recorded to interest expense in the period in which the gains and losses occur. We have designated and account for interest rate swaps that convert floating rate interest payments into fixed rate interest payments as cash flow hedges of the forecasted payment obligations. The gains and losses resulting from fair value adjustments to the interest rate swap are recorded to AOCI.
We periodically hedge the forecasted fixed-coupon interest payments associated with anticipated debt offerings, using forward starting interest rate swaps, interest rate locks, or similar derivatives. These agreements effectively lock a portion of our interest rate exposure between the time the agreement is entered into and the date when the debt offering is completed, thereby mitigating the impact of interest rate changes on future interest expense. These derivatives are settled commensurate with the issuance of the debt, and any gain or loss upon settlement is amortized as an adjustment to the effective interest yield on the debt.
Outstanding Positions
The notional amounts of our outstanding derivative positions were as follows:
| December 31, 2010 Notional Value |
December 31, 2009 Notional Value |
|||||||
| Currency Hedges: |
||||||||
| Euro |
€ | 1,732 | € | 1,372 | ||||
| British Pound Sterling |
£ | 871 | £ | 692 | ||||
| Canadian Dollar |
C$ | 289 | C$ | 228 | ||||
| Interest Rate Hedges: |
||||||||
| Fixed to Floating Interest Rate Swaps |
$ | 6,000 | $ | 3,751 | ||||
| Floating to Fixed Interest Rate Swaps |
$ | 53 | $ | 28 | ||||
As of December 31, 2010, we had no outstanding commodity hedge positions. The maximum term over which we are hedging exposures to the variability of cash flow is 39 years.
107
UNITED PARCEL SERVICE, INC. AND SUBSIDIARIES
NOTES TO CONSOLIDATED FINANCIAL STATEMENTS—(Continued)
Balance Sheet Recognition
The following table indicates the location on the balance sheet in which our derivative assets and liabilities have been recognized, and the related fair values of those derivatives (in millions). The table is segregated between those derivative instruments that qualify and are designated as hedging instruments and those that are not, as well as by type of contract and whether the derivative is in an asset or liability position.
| Asset Derivatives |
Balance Sheet Location | Fair Value Hierarchy Level |
December 31, 2010 Fair Value |
December 31, 2009 Fair Value |
||||||||||||
| Derivatives designated as hedges: |
||||||||||||||||
| Foreign exchange contracts |
Other current assets | Level 2 | $ | 36 | $ | 63 | ||||||||||
| Interest rate contracts |
Other non-current assets | Level 2 | 182 | 74 | ||||||||||||
| Total Asset Derivatives |
$ | 218 | $ | 137 | ||||||||||||
| Liability Derivatives |
Balance Sheet Location | Fair Value Hierarchy Level |
December 31, 2010 Fair Value |
December 31, 2009 Fair Value |
||||||||||||
| Derivatives designated as hedges: |
||||||||||||||||
| Foreign exchange contracts |
Other current liabilities | Level 2 | $ | (9 | ) | $ | — | |||||||||
| Foreign exchange contracts |
Other non-current liabilities | Level 2 | (99 | ) | (51 | ) | ||||||||||
| Interest rate contracts |
Other non-current liabilities | Level 2 | (29 | ) | (13 | ) | ||||||||||
| Derivatives not designated as hedges: |
||||||||||||||||
| Interest rate contracts |
Other non-current liabilities | Level 2 | (1 | ) | (2 | ) | ||||||||||
| Foreign exchange contracts |
Other current liabilities | Level 2 | (3 | ) | — | |||||||||||
| Total Liability Derivatives |
$ | (141 | ) | $ | (66 | ) | ||||||||||
Income Statement Recognition
The following table indicates the amount and location in the income statement in which derivative gains and losses, as well as the related amounts reclassified from AOCI, have been recognized for those derivatives designated as cash flow hedges for the years ended December 31, 2010 and 2009 (in millions):
| Derivative Instruments in Cash |
2010 Amount of Gain (Loss) Recognized in OCI on Derivative (Effective Portion) |
2009 Amount of Gain (Loss) Recognized in OCI on Derivative (Effective Portion) |
Location of Gain (Loss) Reclassified from Accumulated OCI into Income (Effective Portion) |
2010 Amount of Gain (Loss) Reclassified from Accumulated OCI into Income (Effective Portion) |
2009 Amount of Gain (Loss) Reclassified from Accumulated OCI into Income (Effective Portion) |
|||||||||||||
| Interest rate contracts |
$ | 7 | $ | 127 | Interest Expense | $ | (18 | ) | $ | (15 | ) | |||||||
| Foreign exchange contracts |
(48 | ) | (42 | ) | Interest Expense | (27 | ) | (4 | ) | |||||||||
| Foreign exchange contracts |
30 | (75 | ) | Revenue | 96 | 96 | ||||||||||||
| Commodity contracts |
— | — | Revenue | — | 82 | |||||||||||||
| Total |
$ | (11 | ) | $ | 10 | $ | 51 | $ | 159 | |||||||||
As of December 31, 2010, $55 million of pre-tax losses related to cash flow hedges that are currently deferred in AOCI are expected to be reclassified to income over the 12 month period ended December 31, 2011.
108
UNITED PARCEL SERVICE, INC. AND SUBSIDIARIES
NOTES TO CONSOLIDATED FINANCIAL STATEMENTS—(Continued)
The actual amounts that will be reclassified to income over the next 12 months will vary from this amount as a result of changes in market conditions. The amount of ineffectiveness recognized in income on derivative instruments designated in cash flow hedging relationships was immaterial for the years ended December 31, 2010, 2009 and 2008.
The following table indicates the amount and location in the income statement in which derivative gains and losses, as well as the associated gains and losses on the underlying exposure, have been recognized for those derivatives designated as fair value hedges for the years ended December 31, 2010 and 2009 (in millions):
| Derivative Instruments in |
Location of Gain (Loss) Recognized in Income |
2010 Amount of Gain (Loss) Recognized in Income |
2009 Amount of Gain (Loss) Recognized in Income |
Hedged Items in Fair Value Hedging Relationships |
Location of Gain (Loss) Recognized in Income |
2010 Amount of Gain (Loss) Recognized in Income |
2009 Amount of Gain (Loss) Recognized in Income |
|||||||||||||||||
| Interest rate contracts |
Interest Expense | $ | 134 | $ | 68 | Fixed-Rate Debt and Capital Leases |
Interest Expense | $ | (134 | ) | $ | (68 | ) | |||||||||||
Additionally, we maintain some interest rate swap and foreign exchange forward contracts that are not designated as hedges. These interest rate swap contracts are intended to provide an economic hedge of a portfolio of interest bearing receivables, however the income statement impact of these hedges was not material for any period presented. These foreign exchange forward contracts are intended to provide an economic offset to foreign currency remeasurement risks for certain assets and liabilities in our balance sheet. The following is a summary of the amounts recorded in the statements of consolidated income related to fair value changes and settlements of these foreign currency forward contracts not designated as hedges for the years ended December 31, 2010 and 2009 (in millions):
| Derivative Instruments Not Designated in |
Location of Gain (Loss) Recognized in Income |
2010 Amount of Gain (Loss) Recognized in Income |
2009 Amount of Gain (Loss) Recognized in Income |
|||||||||
| Foreign Exchange Contracts |
Other Operating Expenses | $ | 13 | $ | (15 | ) | ||||||
109
UNITED PARCEL SERVICE, INC. AND SUBSIDIARIES
NOTES TO CONSOLIDATED FINANCIAL STATEMENTS—(Continued)
Fair Value Measurements
Our foreign currency, interest rate, and energy derivatives are largely comprised of over-the-counter derivatives, which are primarily valued using pricing models that rely on market observable inputs such as yield curves, currency exchange rates, and commodity forward prices, and therefore are classified as Level 2. The fair values of our derivative assets and liabilities as of December 31, 2010 and 2009 by hedge type are as follows (in millions):
| Quoted Prices in Active Markets for Identical Assets (Level 1) |
Significant Other Observable Inputs (Level 2) |
Significant Unobservable Inputs (Level 3) |
Balance as of December 31, 2010 |
|||||||||||||
| 2010: |
||||||||||||||||
| Assets |
||||||||||||||||
| Foreign Exchange Contracts |
$ | — | $ | 36 | $ | — | $ | 36 | ||||||||
| Interest Rate Contracts |
— | 182 | — | 182 | ||||||||||||
| Total |
$ | — | $ | 218 | $ | — | $ | 218 | ||||||||
| Liabilities |
||||||||||||||||
| Foreign Exchange Contracts |
$ | — | $ | 111 | $ | — | $ | 111 | ||||||||
| Interest Rate Contracts |
— | 30 | — | 30 | ||||||||||||
| Total |
$ | — | $ | 141 | $ | — | $ | 141 | ||||||||
| Quoted Prices in Active Markets for Identical Assets (Level 1) |
Significant Other Observable Inputs (Level 2) |
Significant Unobservable Inputs (Level 3) |
Balance as of December 31, 2009 |
|||||||||||||
| 2009: |
||||||||||||||||
| Assets |
||||||||||||||||
| Foreign Exchange Contracts |
$ | — | $ | 63 | $ | — | $ | 63 | ||||||||
| Interest Rate Contracts |
— | 74 | — | 74 | ||||||||||||
| Total |
$ | — | $ | 137 | $ | — | $ | 137 | ||||||||
| Liabilities |
||||||||||||||||
| Foreign Exchange Contracts |
$ | — | $ | 51 | $ | — | $ | 51 | ||||||||
| Interest Rate Contracts |
— | 15 | — | 15 | ||||||||||||
| Total |
$ | — | $ | 66 | $ | — | $ | 66 | ||||||||
NOTE 15. RESTRUCTURING COSTS AND BUSINESS DISPOSITIONS
We have incurred restructuring costs associated with the termination of employees, facility consolidations and other costs directly related to restructuring initiatives. These initiatives have resulted from the integration of acquired companies, as well as restructuring activities associated with cost containment and operational efficiency programs. Additionally, we have sold or shut-down certain non-core business units in 2010, and recorded gains or losses upon the sale, as well as costs associated with each transaction.
Supply Chain & Freight—Germany
In February 2010, we completed the sale of a specialized transportation and express freight business in Germany within our Supply Chain & Freight segment. As part of the sale transaction, we incurred certain costs
110
UNITED PARCEL SERVICE, INC. AND SUBSIDIARIES
NOTES TO CONSOLIDATED FINANCIAL STATEMENTS—(Continued)
associated with employee severance payments, other employee benefits, transition services, and leases on operating facilities and equipment. Additionally, we have provided a guarantee for a period of two years for certain employee benefit payments being assumed by the buyer. We recorded a pre-tax loss of $51 million ($47 million after-tax) for this transaction in 2010, which included the costs associated with the sale transaction and the fair value of the guarantee. This loss is recorded in the caption “other expenses” in the statements of consolidated income.
Supply Chain & Freight—United States
In December 2010, we completed the sale of our UPS Logistics Technologies, Inc. business unit, which produced transportation routing and fleet management systems. We recognized a $71 million pre-tax gain on the sale ($44 million after tax), which is included in the caption “other expenses” in the consolidated income statement, and is included in the results of our Supply Chain & Freight segment. The operating results of the UPS Logistics Technologies, Inc business unit were not material to our consolidated or segment operating results in any of the periods presented.
U.S. Domestic Package Restructuring
In an effort to improve performance in the U.S. Domestic Package segment, we announced a program to streamline our domestic management structure in January 2010. As part of this restructuring, we reduced the number of domestic districts and regions in our U.S. small package operation in order to better align our operations geographically and allow more local decision-making and resources to be deployed for our customers. Effective in April 2010, we reduced our U.S. regions from five to three and our U.S. districts from 46 to 20. The restructuring eliminated approximately 1,800 management and administrative positions in the U.S. Approximately 1,100 employees were offered voluntary severance packages, while other impacted employees received severance benefits based on length of service, and access to support programs. We recorded a pre-tax charge of $98 million ($64 million after-tax) in the first quarter of 2010 related to the costs of this program, which reflects the value of voluntary retirement benefits, severance benefits and unvested stock compensation. In 2010, we incurred additional costs related to the relocation of employees and other restructuring activities, however those costs were offset by savings from the staffing reductions.
NOTE 16. QUARTERLY INFORMATION (unaudited)
| First Quarter | Second Quarter | Third Quarter | Fourth Quarter | |||||||||||||||||||||||||||||
| 2010 | 2009 | 2010 | 2009 | 2010 | 2009 | 2010 | 2009 | |||||||||||||||||||||||||
| Revenue: |
||||||||||||||||||||||||||||||||
| U.S. Domestic Package |
$ | 7,102 | $ | 6,949 | $ | 7,269 | $ | 6,789 | $ | 7,291 | $ | 6,868 | $ | 8,080 | $ | 7,552 | ||||||||||||||||
| International Package |
2,639 | 2,240 | 2,771 | 2,246 | 2,676 | 2,422 | 3,047 | 2,791 | ||||||||||||||||||||||||
| Supply Chain & Freight |
1,987 | 1,749 | 2,164 | 1,794 | 2,225 | 1,863 | 2,294 | 2,034 | ||||||||||||||||||||||||
| Total revenue |
11,728 | 10,938 | 12,204 | 10,829 | 12,192 | 11,153 | 13,421 | 12,377 | ||||||||||||||||||||||||
| Operating profit: |
||||||||||||||||||||||||||||||||
| U.S. Domestic Package |
562 | 384 | 748 | 476 | 1,020 | 514 | 1,043 | 764 | ||||||||||||||||||||||||
| International Package |
427 | 294 | 521 | 293 | 419 | 313 | 537 | 467 | ||||||||||||||||||||||||
| Supply Chain & Freight |
53 | 40 | 133 | 126 | 177 | 102 | 234 | 28 | ||||||||||||||||||||||||
| Total operating profit |
1,042 | 718 | 1,402 | 895 | 1,616 | 929 | 1,814 | 1,259 | ||||||||||||||||||||||||
| Net income |
$ | 533 | $ | 401 | $ | 845 | $ | 445 | $ | 991 | $ | 549 | $ | 1,119 | $ | 757 | ||||||||||||||||
| Earnings per share: |
||||||||||||||||||||||||||||||||
| Basic |
$ | 0.54 | $ | 0.40 | $ | 0.85 | $ | 0.45 | $ | 1.00 | $ | 0.55 | $ | 1.13 | $ | 0.76 | ||||||||||||||||
| Diluted |
$ | 0.53 | $ | 0.40 | $ | 0.84 | $ | 0.44 | $ | 0.99 | $ | 0.55 | $ | 1.11 | $ | 0.75 | ||||||||||||||||
111
UNITED PARCEL SERVICE, INC. AND SUBSIDIARIES
NOTES TO CONSOLIDATED FINANCIAL STATEMENTS—(Continued)
First quarter 2010 U.S. Domestic Package operating profit includes a $98 million restructuring charge related to the reorganization of our domestic management structure, as discussed in Note 15. First quarter 2010 Supply Chain & Freight operating profit includes a $38 million loss on the sale of a specialized transportation business in Germany, also discussed in Note 15. Additionally, first quarter 2010 net income includes a $76 million charge to income tax expense, resulting from a change in the tax filing status of a German subsidiary, as discussed in Note 12. The combined impact of these items reduced net income by $175 million, basic earnings per share by $0.17, and diluted earnings per share by $0.18.
Third quarter 2010 U.S. Domestic Package operating profit includes a $109 million gain on the sale of real estate. This gain increased net income by $61 million, and basic and diluted earnings per share by $0.06.
Fourth quarter 2010 Supply Chain & Freight operating profit includes a $71 million gain on the sale of UPS Logistics Technologies and a $13 million loss related to a financial guarantee associated with the specialized transportation business sold in the first quarter of 2010, which are discussed in Note 15. The combined impact of these items increased net income by $32 million, basic earnings per share by $0.04, and diluted earnings per share by $0.03.
First quarter 2009 U.S. Domestic Package operating profit includes the $181 million impairment charge on our McDonnell-Douglas DC-8-71 and DC-8-73 airframes, engines, and parts, as discussed in Note 4. This charge reduced first quarter net income by $116 million, and basic and diluted earnings per share by $0.12.
Second quarter 2009 interest expense includes a $77 million charge for the remeasurement of certain obligations denominated in foreign currencies, in which hedge accounting was not able to be applied. This charge reduced second quarter net income by $48 million, basic earnings per share by $0.04, and diluted earnings per share by $0.05.
| Item 9. | Changes in and Disagreements with Accountants on Accounting and Financial Disclosure |
None.
112
| Item 9A. | Controls and Procedures |
Evaluation of Disclosure Controls and Procedures:
As of the end of the period covered by this report, management, including our chief executive officer and chief financial officer, evaluated the effectiveness of the design and operation of our disclosure controls and procedures and internal controls over financial reporting. Based upon, and as of the date of, the evaluation, our chief executive officer and chief financial officer concluded that the disclosure controls and procedures and internal controls over financial reporting were effective to ensure that information required to be disclosed in the reports we file and submit under the Exchange Act is recorded, processed, summarized and reported as and when required and is accumulated and communicated to our management, including the Chief Executive Officer and Chief Financial Officer, as appropriate to allow timely decisions regarding required disclosure.
Changes in Internal Control over Financial Reporting:
There were no changes in the Company’s internal controls over financial reporting during the quarter ended December 31, 2010 that have materially affected, or are reasonably likely to materially affect, the Company’s internal control over financial reporting.
Management’s Report on Internal Control Over Financial Reporting:
UPS management is responsible for establishing and maintaining adequate internal controls over financial reporting for United Parcel Service, Inc. and its subsidiaries (the “Company”). Based on the criteria for effective internal control over financial reporting established in Internal Control—Integrated Framework issued by the Committee of Sponsoring Organizations of the Treadway Commission, management has assessed the Company’s internal control over financial reporting as effective as of December 31, 2010. The independent registered public accounting firm of Deloitte & Touche LLP, as auditors of the consolidated balance sheets of United Parcel Service, Inc. and its subsidiaries as of December 31, 2010 and the related consolidated statements of income, comprehensive income and cash flows for the year ended December 31, 2010, has issued an attestation report on the Company’s internal control over financial reporting, which is included herein.
United Parcel Service, Inc.
February 28, 2011
| Item 9B. | Other Information |
None.
113
PART III
| Item 10. | Directors, Executive Officers and Corporate Governance |
Executive Officers of the Registrant
| Name and Office |
Age | Principal Occupation and Employment For the Last Five Years | ||||
| David P. Abney Senior Vice President and Chief Operating Officer |
55 | Senior Vice President and Chief Operating Officer (2007 – present), President, UPS Airlines (2007 – 2008), Senior Vice President and President, UPS International (2003 – 2007). | ||||
| David A. Barnes Senior Vice President and Chief Information Officer |
55 | Senior Vice President and Chief Information Officer (2005 – present). | ||||
| Daniel J. Brutto Senior Vice President and President, UPS International |
54 | Senior Vice President and President, UPS International (2008 – present), President, Global Freight Forwarding (2006-2007), Corporate Controller (2004 – 2006). | ||||
| D. Scott Davis Chairman and Chief Executive Officer |
59 | Chairman and Chief Executive Officer (2008 – present), Vice Chairman (2006 – 2007), Senior Vice President, Chief Financial Officer and Treasurer (2001 – 2007), Director (2006 – present). | ||||
| Alan Gershenhorn Senior Vice President |
52 | Senior Vice President, Worldwide Sales, Marketing and Strategy (2011 – present), Senior Vice President, Worldwide Sales and Marketing (2008 – 2010), Senior Vice President and President, UPS International (2007), President, UPS Supply Chain Solutions – Asia and Europe (2006). | ||||
| Myron Gray Senior Vice President |
53 | Senior Vice President, U.S. Operations (2009 – present), Vice President, Americas Region (2008 – 2009), Vice President, North Central Region (2004-2008). | ||||
| Allen E. Hill Senior Vice President |
55 | Senior Vice President, Human Resources (2007 – present), Senior Vice President, Human Resources and Public Affairs (2006 – 2007), Senior Vice President, General Counsel and Corporate Secretary (2004 – 2006). | ||||
| Kurt P. Kuehn Senior Vice President and Chief Financial Officer |
56 | Senior Vice President and Chief Financial Officer (2008 – present), Treasurer (2008 – 2010), Senior Vice President, Worldwide Sales and Marketing (2004 – 2007). | ||||
114
| Name and Office |
Age | Principal Occupation and Employment For the Last Five Years | ||||
| Teri P. McClure Senior Vice President, General Counsel and Corporate Secretary |
47 | Senior Vice President of Legal, Compliance and Public Affairs, General Counsel and Corporate Secretary (2006 – present), Corporate Legal Department Manager (2005 – 2006). | ||||
| John J. McDevitt Senior Vice President |
52 | Senior Vice President, Global Transportation Services and Labor Relations (2005 – present). | ||||
| Christine M. Owens Senior Vice President |
55 | Senior Vice President, Communications and Brand Management (2005 – present). | ||||
Information about our directors is presented under the caption “Election of Directors” in our definitive Proxy Statement for the Annual Meeting of Shareowners to be held on May 5, 2011 and is incorporated herein by reference.
Information about our Audit Committee is presented under the caption “Election of Directors—Committees of the Board of Directors—Audit Committee” in our definitive Proxy Statement for the Annual Meeting of Shareowners to be held on May 5, 2011 and is incorporated herein by reference.
Information about our Code of Business Conduct is presented under the caption “Where You Can Find More Information” in Part I, Item 1 of this report.
Information about our compliance with Section 16 of the Exchange Act of 1934, as amended, is presented under the caption “Section 16(a) Beneficial Ownership Reporting Compliance” in our definitive Proxy Statement for the Annual Meeting of Shareowners to be held on May 5, 2011 and is incorporated herein by reference.
| Item 11. | Executive Compensation |
Information about executive compensation is presented under the captions “Compensation Discussion and Analysis,” “Compensation of Executive Officers,” “Compensation of Directors,” “Report of the Compensation Committee” and “Compensation Committee Interlocks and Insider Participation” in our definitive Proxy Statement for the Annual Meeting of Shareowners to be held on May 5, 2011 and is incorporated herein by reference.
| Item 12. | Security Ownership of Certain Beneficial Owners and Management and Related Stockholder Matters |
Information about security ownership is presented under the caption “Beneficial Ownership of Common Stock” in our definitive Proxy Statement for the Annual Meeting of Shareowners to be held on May 5, 2011 and is incorporated herein by reference.
Information about our equity compensation plans is presented under the caption “Equity Compensation Plans” in our definitive Proxy Statement for the Annual Meeting of Shareowners to be held on May 5, 2011 and is incorporated herein by reference.
| Item 13. | Certain Relationships and Related Transactions, and Director Independence |
Information about transactions with related persons is presented under the caption “Related Person Transactions” in our definitive Proxy Statement for the Annual Meeting of Shareowners to be held on May 5, 2011 and is incorporated herein by reference.
115
Information about director independence is presented under the caption “Election of Directors—Director Independence” in our definitive Proxy Statement for the Annual Meeting of Shareowners to be held on May 5, 2011 and is incorporated herein by reference.
| Item 14. | Principal Accounting Fees and Services |
Information about aggregate fees billed to us by our principal accountant is presented under the caption “Principal Accounting Firm Fees” in our definitive Proxy Statement for the Annual Meetings of Shareowners to be held on May 5, 2011 and is incorporated herein by reference.
116
PART IV
| Item 15. | Exhibits and Financial Statement Schedules |
(a) 1. Financial Statements.
See Item 8 for the financial statements filed with this report.
2. Financial Statement Schedules.
None.
3. List of Exhibits.
See the Exhibit Index for a list of the exhibits incorporated by reference into or filed with this report.
(b) Exhibits required by Item 601 of Regulation S-K.
See the Exhibit Index for a list of the exhibits incorporated by reference into or filed with this report.
(c) Financial Statement Schedules.
None.
117
SIGNATURES
Pursuant to the requirements of Section 13 or 15(d) of the Securities Exchange Act of 1934, United Parcel Service, Inc. has duly caused this report to be signed on its behalf by the undersigned, thereunto duly authorized.
| UNITED PARCEL SERVICE, INC. | ||
| (REGISTRANT) | ||
| By: | /S/ D. SCOTT DAVIS | |
| D. Scott Davis | ||
| Chairman and Chief Executive Officer | ||
Date: February 28, 2011
Pursuant to the requirements of the Securities Exchange Act of 1934, this report has been signed below by the following persons on behalf of the Registrant and in the capacities and on the dates indicated.
| Signature |
Title |
Date | ||
| /S/ F. DUANE ACKERMAN F. Duane Ackerman |
Director | February 21, 2011 | ||
| /S/ MICHAEL J. BURNS Michael J. Burns |
Director | February 21, 2011 | ||
| /S/ D. SCOTT DAVIS D. Scott Davis |
Chairman, Chief Executive Officer and Director (Principal Executive Officer) | February 28, 2011 | ||
| /S/ STUART E. EIZENSTAT Stuart E. Eizenstat |
Director | February 24, 2011 | ||
| /S/ MICHAEL L. ESKEW Michael L. Eskew |
Director | February 28, 2011 | ||
| /S/ WILLIAM R. JOHNSON William R. Johnson |
Director | February 20, 2011 | ||
| /S/ KURT P. KUEHN Kurt P. Kuehn |
Chief Financial Officer (Principal Financial and Accounting Officer) | February 28, 2011 | ||
| /S/ ANN M. LIVERMORE Ann M. Livermore |
Director | February 23, 2011 | ||
| /S/ RUDY MARKHAM Rudy Markham |
Director | February 28, 2011 | ||
| /S/ CLARK T. RANDT, JR. Clark T. Randt, Jr. |
Director | February 23, 2011 | ||
| /S/ JOHN W. THOMPSON John W. Thompson |
Director | February 28, 2011 | ||
| /S/ CAROL B. TOMÉ Carol B. Tomé |
Director | February 28, 2011 | ||
118
EXHIBIT INDEX
| Exhibit No. |
Description | |||
| 2.1 | — | Agreement and Plan of Merger, dated as of September 22, 1999, among United Parcel Service of America, Inc., United Parcel Service, Inc. and UPS Merger Subsidiary, Inc. (incorporated by reference to the registration statement on Form S-4 (No. 333-83349), filed on July 21, 1999, as amended). | ||
| 2.2 | — | Agreement and Plan of Merger, dated as of May 15, 2005, among United Parcel Service, Inc., Overnite Corporation, and Olympic Merger Sub, Inc. (incorporated by reference to Form 8-K, filed on May 18, 2005). | ||
| 3.1 | — | Form of Restated Certificate of Incorporation of United Parcel Service, Inc. (incorporated by reference to Exhibit 3.2 to Form 8-K filed on May 12, 2010). | ||
| 3.2 | — | Amended and Restated Bylaws of United Parcel Service, Inc. as of May 6, 2010 (incorporated by reference to Exhibit 3.1 to Form 8-K, filed on May 12, 2010). | ||
| 4.1 | — | Form of Class A Common Stock Certificate (incorporated by reference to Exhibit 4.1 to the registration statement on Form S-4 (No. 333-83349), filed on July 21, 1999, as amended). | ||
| 4.2 | — | Form of Class B Common Stock Certificate (incorporated by reference to Exhibit 4.2 to the registration statement on Form S-4 (No. 333-83349), filed on July 21, 1999). | ||
| 4.3 | — | Specimen Certificate of 8 3/8% Debentures due April 1, 2020 (incorporated by reference to Exhibit 4(c) to Registration Statement No. 33-32481, filed December 7, 1989). | ||
| 4.4 | — | Indenture relating to 8 3/8% Debentures due April 1, 2020 (incorporated by reference to Exhibit 4(c) to Registration Statement No. 33-32481, filed December 7, 1989). | ||
| 4.5 | — | Specimen Certificate of 8 3/8% Debentures due April 1, 2030 (incorporated by reference to Exhibit T-3C to Form T-3 filed December 18, 1997). | ||
| 4.6 | — | Indenture relating to Exchange Offer Notes Due 2030 (incorporated by reference to Exhibit T-3C to Form T-3 filed December 18, 1997). | ||
| 4.7 | — | Indenture relating to $2,000,000,000 of debt securities (incorporated by reference to Exhibit 4.1 to Pre-Effective Amendment No. 1 to Registration Statement on Form S-3 (No. 333-08369), filed on January 26, 1999). | ||
| 4.8 | — | Form of Supplemental Indenture relating to $2,000,000,000 of debt securities (incorporated by reference to Exhibit 4.2 to Post-Effective Amendment No. 1 to Registration Statement on Form S-3 (No. 333-08369-01), filed on March 15, 2000). | ||
| 4.9 | — | Form of Second Supplemental Indenture relating to $2,000,000,000 of debt securities (incorporated by reference to Exhibit 4 to Form 10-Q for the Quarter Ended September 30, 2001). | ||
| 4.10 | — | Form of Indenture relating to $2,000,000,000 of debt securities (incorporated by reference to Exhibit 4.1 to Registration Statement on Form S-3 (No. 333-108272), filed on August 27, 2003). | ||
| 4.11 | — | Form of Underwriting Agreement relating to $2,000,000,000 of debt securities (incorporated by reference to Exhibit 1.1 to Registration Statement on Form S-3 (No. 333-108272), filed on August 27, 2003). | ||
| 4.12 | — | Distribution Agreement relating to UPS Notes with maturities of 9 months or more from date of issue (incorporated by reference to Exhibit 10.1 to Form 8-K filed on May 30, 2008) and Form of Note (incorporated by reference to Exhibit 4.1 to Form 8-K filed on May 30, 2008). | ||
119
| Exhibit No. |
Description | |||
| 4.13 | — | Underwriting agreement relating to 4.50% Senior Notes due January 15, 2013, 5.50% Senior Notes due January 15, 2018 and 6.20% Senior Notes due January 15, 2038 (incorporated by reference to Exhibit 1.1 to Form 8-K filed on January 15, 2008). | ||
| 4.14 | — | Form of Note for 4.50% Senior Notes due January 15, 2013 (incorporated by reference to Exhibit 4.1 to Form 8-K filed on January 15, 2008). | ||
| 4.15 | — | Form of Note for 5.50% Senior Notes due January 15, 2018 (incorporated by reference to Exhibit 4.2 to Form 8-K filed on January 15, 2008). | ||
| 4.16 | — | Form of Note for 6.20% Senior Notes due January 15, 2038 (incorporated by reference to Exhibit 4.3 to Form 8-K filed on January 15, 2008). | ||
| 4.17 | — | Underwriting agreement relating to 3.875% Senior Notes due April 1, 2014 and 5.125% Senior Notes due April 1, 2019 (incorporated by reference to Exhibit 1.1 to Form 8-K filed on March 24, 2009). | ||
| 4.18 | — | Form of Note for 3.875% Senior Notes due April 1, 2014 (incorporated by reference to Exhibit 4.1 to Form 8-K filed on March 24, 2009). | ||
| 4.19 | — | Form of Note for 5.125% Senior Notes due April 1, 2019 (incorporated by reference to Exhibit 4.2 to Form 8-K filed on March 24, 2009). | ||
| 4.20 | — | Underwriting Agreement relating to $1,500,000,000 aggregate principal amount of 3.125% Senior Notes due January 15, 2021, and $500,000,000 aggregate principal amount of 4.875% Senior Notes due November 15, 2040 (incorporated by reference to Exhibit 1.1 to Form 8-K filed on November 12, 2010). | ||
| 4.21 | — | Form of Note for 3.125% Senior Notes due January 15, 2021 (incorporated by reference to Exhibit 4.1 to Form 8-K filed on November 12, 2010). | ||
| 4.22 | — | Form of Note for 4.875% Senior Notes due November 15, 2040 (incorporated by reference to Exhibit 4.2 to Form 8-K filed on November 12, 2010). | ||
| 10.1 | — | UPS Thrift Plan, as Amended and Restated, including Amendment Nos. 1 through 24 (incorporated by reference to Exhibit 10.1 to 2001 Annual Report on Form 10-K). | ||
| (1) Amendment No. 25 to the UPS Thrift Plan (incorporated by reference to Exhibit 10.1(1) to 2002 Annual Report on Form 10-K). | ||||
| 10.2 | — | UPS Retirement Plan, as Amended and Restated, effective January 1, 2010 (incorporated by reference to Exhibit 10.2 to the 2009 Annual Report on Form 10-K). | ||
| †(1) Amendment No. 1 to the UPS Retirement Plan. | ||||
| 10.3 | — | UPS Savings Plan, as Amended and Restated (incorporated by reference to Exhibit 10.3 to 2008 Annual Report on Form 10-K). | ||
| (1) Amendment No. 1 to the UPS Savings Plan (incorporated by reference to Exhibit 10.1 to 2009 Annual Report on Form 10-K). | ||||
| (2) Amendment No. 2 to the UPS Savings Plan (incorporated by reference to Exhibit 10.2 to 2009 Annual Report on Form 10-K). | ||||
| †(3) Amendment No. 3 to the UPS Savings Plan. | ||||
120
| Exhibit No. |
Description | |||
| 10.4 | — | Credit Agreement (364-Day Facility) dated April 15, 2010 among United Parcel Service, Inc., the initial lenders named therein, Citigroup Global Markets Inc. and J.P. Morgan Securities Inc. as joint arrangers and book managers, Barclays Capital and BNP Paribas as co-documentation agents, Citibank, N.A. as administrative agent, and J.P. Morgan Securities, Inc. as syndication agent (incorporated by reference to Exhibit 10.1 to Form 10-Q for the Quarter Ended March 31, 2010). | ||
| 10.5 | — | Credit Agreement (5-Year Facility) dated April 19, 2007 among United Parcel Service, Inc., the initial lenders named therein, Citigroup Global Markets Inc. and J.P. Morgan Securities Inc. as joint arrangers and book managers, Barclays Bank PLC, BNP Paribas, Mellon Bank N.A., and Wells Fargo Bank, N.A. as co-documentation agents, Citibank, N.A. as administrative agent, and JPMorgan Chase Bank, N.A., as syndication agent (incorporated by reference to Exhibit 10.2 to Form 10-Q for the Quarter Ended March 31, 2007). | ||
| 10.6 | — | UPS Excess Coordinating Benefit Plan, as amended and restated (incorporated by reference to Exhibit 10.6 to 2008 Annual Report on Form 10-K). | ||
| (1) Amendment No. 1 to the UPS Excess Coordinating Benefit Plan (incorporated by reference to Exhibit 10.6(1) to 2009 Annual Report on Form 10-K). | ||||
| 10.7 | — | UPS 1996 Stock Option Plan, as amended and restated (incorporated by reference to Exhibit 10.9 to 2003 Annual Report on Form 10-K). | ||
| 10.8 | — | UPS Qualified Stock Ownership Plan and Trust Agreement (incorporated by reference to Exhibit 4.1 to Registration Statement No. 333-67479, filed November 18, 1998). | ||
| (1) Amendment No. 17 to the UPS Qualified Stock Ownership Plan and Trust Agreement (incorporated by reference to Exhibit 10.9(17) to 2008 Annual Report on Form 10-K). | ||||
| 10.9 | — | Form of United Parcel Service, Inc. Incentive Compensation Plan (incorporated by reference to the registration statement on Form S-4 (No. 333-83349), filed on July 21, 1999, as amended). | ||
| (1) Form of Non-Qualified Stock Option Award Agreement and Restricted Performance Unit Award Agreement (incorporated by reference to Exhibit 10.11(1) to 2004 Annual Report on Form 10-K). | ||||
| (2) Form of Restricted Stock Award Agreement (incorporated by reference to Exhibit 10.7 to Quarterly Report on Form 10-Q for the Quarter Ended March 31, 2005). | ||||
| (3) Form of Nonqualified Stock Option Award Agreement (incorporated by reference to Exhibit 10.1 to the Current Report on Form 8-K, filed on May 5, 2006). | ||||
| (4) Form of Restricted Performance Unit Award Agreement (incorporated by reference to Exhibit 10.2 to the Current Report on Form 8-K filed on May 5, 2006). | ||||
| (5) Form of Restricted Stock Unit Award Agreement for the 2007 Long-Term Incentive Performance Awards under the Incentive Compensation Plan (incorporated by reference to Exhibit 10.1 to Form 8-K, filed on March 7, 2007). | ||||
| (6) Form of First Amendment to Restricted Stock Award Agreement for Non-Management Directors under the Incentive Compensation Plan (incorporated by reference to Exhibit 10.4 to Quarterly Report on Form 10-Q for the Quarter Ended September 30, 2007). | ||||
| (7) Form of Restricted Stock Unit Award Agreement for the 2008 Long-Term Incentive Performance Awards under the Incentive Compensation Plan (incorporated by reference to Exhibit 10.1 to Form 8-K, filed on March 20, 2008). | ||||
| (8) Form of Restricted Stock Unit Award Agreement for the 2009 Long-Term Incentive Performance Awards under the Incentive Compensation Plan (incorporated by reference to Exhibit 10.1 to Form 8-K, filed on February 17, 2009). | ||||
121
| Exhibit No. |
Description | |||
| 10.10 | — | United Parcel Service, Inc. 2009 Omnibus Incentive Compensation Plan (incorporated by reference to Annex II to the Definitive Proxy Statement, filed on March 13, 2009). | ||
| (1) Form of 2010 Long-Term Incentive Performance Award Grants (incorporated by reference to Exhibit 10.1 to Form 8-K filed on March 3, 2010). | ||||
| (2) Form of Non-Management Director Restricted Stock Unit Award (incorporated by reference to Exhibit 10.2 to Quarterly Report on Form 10-Q for the quarter ended March 3, 2010). | ||||
| †(3) UPS Management Incentive Program Terms and Conditions effective as of January 1, 2011. | ||||
| 10.11 | — | †Form of UPS Deferred Compensation Plan. | ||
| 10.12 | — | United Parcel Service, Inc. Nonqualified Employee Stock Purchase Plan (incorporated by reference to Exhibit 99.1 to the registration statement on Form S-8 (No. 333-34054), filed on April 5, 2000. | ||
| 10.13 | — | Discounted Employee Stock Purchase Plan, as amended and restated, effective October 1, 2002. | ||
| (1) Amendment No. 1 to the Discounted Employee Stock Purchase Plan (incorporated by reference to Exhibit 10.12(1) to the 2005 Annual Report on Form 10-K). | ||||
| (2) AmendmentNo. 2 to the Discounted Employee Stock Purchase Plan (incorporated by reference to Exhibit 10.13(2) to the 2009 Annual Report on Form 10-K). | ||||
| 11 | — | Statement regarding Computation of per Share Earnings (incorporated by reference to Note 13 to Part I, Item 8 “Financial Statements and Supplementary Data” of this Annual Report on Form 10-K). | ||
| †12 | — | Ratio of Earnings to Fixed Charges. | ||
| †21 | — | Subsidiaries of the Registrant. | ||
| †23 | — | Consent of Deloitte & Touche LLP. | ||
| †31.1 | — | Certificate of Chief Executive Officer Pursuant to Rule 13a-14(a), as adopted pursuant to Section 302 of the Sarbanes-Oxley Act of 2002. | ||
| †31.2 | — | Certificate of Chief Financial Officer Pursuant to Rule 13a-14(a), as adopted pursuant to Section 302 of the Sarbanes-Oxley Act of 2002. | ||
| †32.1 | — | Certification of the Chief Executive Officer Pursuant to 18 U.S.C. Section 1350, as Adopted Pursuant to Section 906 of the Sarbanes-Oxley Act of 2002. | ||
| †32.2 | — | Certification of the Chief Financial Officer Pursuant to 18 U.S.C. Section 1350, as Adopted Pursuant to Section 906 of the Sarbanes-Oxley Act of 2002. | ||
| ††101 | — | The following financial information from the Annual Report on Form 10-K for the year ended December 31, 2010, formatted in XBRL (Extensible Business Reporting Language): (i) the Consolidated Balance Sheets, (ii) the Consolidated Statements of Income, (iii) the Consolidated Statements of Comprehensive Income, (iv) the Consolidated Statements of Cash Flows, and (v) the Notes to the Consolidated Financial Statements. | ||
| † | Filed herewith. |
| †† | Furnished electronically herewith. |
122